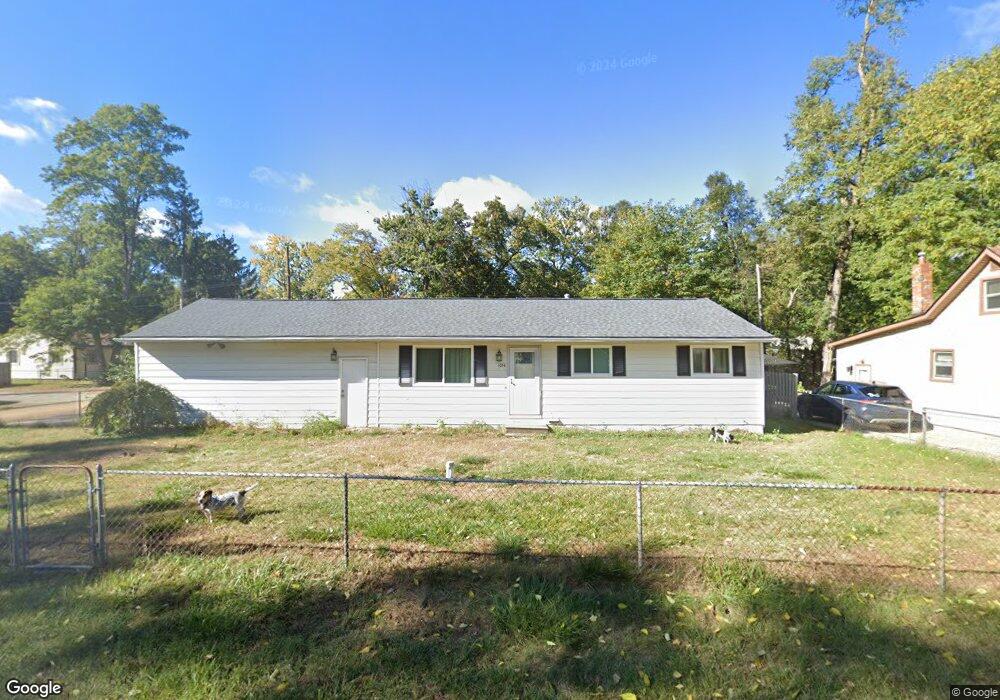
1036 Ennest St White Lake, MI 48386
Estimated Value: $237,000 - $275,163
3
Beds
1
Bath
1,026
Sq Ft
$246/Sq Ft
Est. Value
About This Home
This home is located at 1036 Ennest St, White Lake, MI 48386 and is currently estimated at $252,291, approximately $245 per square foot. 1036 Ennest St is a home located in Oakland County with nearby schools including Clifford H. Smart Middle School, Walled Lake Northern High School, and Lakecrest Baptist School.
Ownership History
Date
Name
Owned For
Owner Type
Purchase Details
Closed on
Oct 19, 2022
Sold by
Grant James and Grant Amanda
Bought by
Mcinnis Logan Joseph
Current Estimated Value
Home Financials for this Owner
Home Financials are based on the most recent Mortgage that was taken out on this home.
Original Mortgage
$216,015
Outstanding Balance
$207,651
Interest Rate
5.89%
Mortgage Type
FHA
Estimated Equity
$44,640
Purchase Details
Closed on
Sep 11, 2015
Sold by
Carling Susan G and Carling Susan Gail
Bought by
Grant James and Grant Amanda
Home Financials for this Owner
Home Financials are based on the most recent Mortgage that was taken out on this home.
Original Mortgage
$125,752
Interest Rate
3.93%
Mortgage Type
VA
Purchase Details
Closed on
Mar 15, 2012
Sold by
Carling Susan G and Carling Susan Gail
Bought by
Carling Susan G and Dudek Patrick
Purchase Details
Closed on
Nov 20, 2011
Sold by
Carling Herber D and Carling Herbert Dale
Bought by
Carling Susan G and Carling Susan Gail
Create a Home Valuation Report for This Property
The Home Valuation Report is an in-depth analysis detailing your home's value as well as a comparison with similar homes in the area
Home Values in the Area
Average Home Value in this Area
Purchase History
| Date | Buyer | Sale Price | Title Company |
|---|---|---|---|
| Mcinnis Logan Joseph | $222,000 | None Listed On Document | |
| Mcinnis Logan Joseph | $222,000 | -- | |
| Grant James | $138,000 | Title Solutions Agency Llc | |
| Carling Susan G | -- | None Available | |
| Carling Susan G | -- | None Available |
Source: Public Records
Mortgage History
| Date | Status | Borrower | Loan Amount |
|---|---|---|---|
| Open | Mcinnis Logan Joseph | $216,015 | |
| Previous Owner | Grant James | $125,752 |
Source: Public Records
Tax History Compared to Growth
Tax History
| Year | Tax Paid | Tax Assessment Tax Assessment Total Assessment is a certain percentage of the fair market value that is determined by local assessors to be the total taxable value of land and additions on the property. | Land | Improvement |
|---|---|---|---|---|
| 2024 | $2,010 | $103,340 | $0 | $0 |
| 2023 | $1,900 | $98,690 | $0 | $0 |
| 2022 | $2,225 | $92,580 | $0 | $0 |
| 2021 | $2,169 | $86,120 | $0 | $0 |
| 2020 | $1,292 | $83,170 | $0 | $0 |
| 2019 | $2,114 | $80,620 | $0 | $0 |
| 2018 | $2,099 | $68,970 | $0 | $0 |
| 2017 | $2,032 | $68,970 | $0 | $0 |
| 2016 | $2,029 | $57,470 | $0 | $0 |
| 2015 | -- | $48,020 | $0 | $0 |
| 2014 | -- | $43,890 | $0 | $0 |
| 2011 | -- | $44,170 | $0 | $0 |
Source: Public Records
Map
Nearby Homes
- 9145 Mandon Rd
- 0000 Holmes Road Holmes St
- 900 Preserve Ln
- 915 Preserve Ln
- 9333 Beechcrest St
- 9439 Garforth St
- 837 Preserve Ln
- 702 Ander Ln Unit 87
- 700 Ander Ln Unit 88
- 9495 Garforth Dr
- 00 Union Lake Rd
- 9526 Cedar Island Rd
- 785 Akehurst Ln
- 8871 Lakeview Dr
- 1337 Park Dr
- 9128 Hickorywood St
- 8993 Haymarket St
- 8760 Cooley Beach Dr
- 1225 Grove Point Dr
- 2577 Midwood Dr
- 1036 Ennest Blvd
- 9120 Funston St
- 1030 Ennest Blvd
- 1030 Ennest St
- 9160 Funston St
- 1020 Ennest St
- 1056 Ennest St
- 9125 Kettering Ave
- 9125 Kettering St
- 1039 Ennest Blvd
- 9123 Funston St
- 9123 Funston Blvd
- 9160 Funston Blvd
- 1039 Ennest Blvd
- 9151 Funston St
- 1029 Ennest St
- 9153 Kettering St
- 9151 Funston Blvd
- 1080 Ennest St
- 1071 Ennest St