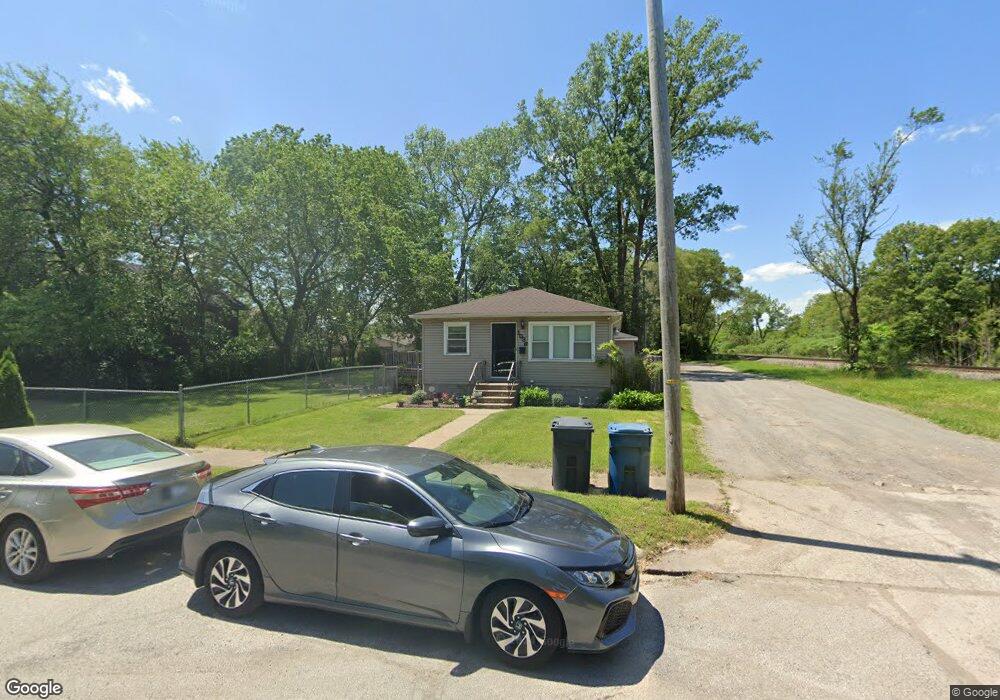
1036 Fillmore St Gary, IN 46402
Midtown NeighborhoodEstimated Value: $81,000 - $126,000
3
Beds
1
Bath
960
Sq Ft
$105/Sq Ft
Est. Value
About This Home
This home is located at 1036 Fillmore St, Gary, IN 46402 and is currently estimated at $100,936, approximately $105 per square foot. 1036 Fillmore St is a home located in Lake County with nearby schools including Beveridge Elementary School, Gary Middle School, and West Side Leadership Academy.
Ownership History
Date
Name
Owned For
Owner Type
Purchase Details
Closed on
Feb 23, 2024
Sold by
Dad Properties Llc
Bought by
Dad Properties Portfolio Vi Llc
Current Estimated Value
Home Financials for this Owner
Home Financials are based on the most recent Mortgage that was taken out on this home.
Original Mortgage
$3,415,500
Outstanding Balance
$2,998,656
Interest Rate
5.87%
Mortgage Type
New Conventional
Estimated Equity
-$2,897,720
Purchase Details
Closed on
Feb 20, 2024
Sold by
Dad Properties Llc
Bought by
Dad Properties Portfolio Vi Llc
Home Financials for this Owner
Home Financials are based on the most recent Mortgage that was taken out on this home.
Original Mortgage
$3,415,500
Outstanding Balance
$2,998,656
Interest Rate
5.87%
Mortgage Type
New Conventional
Estimated Equity
-$2,897,720
Purchase Details
Closed on
Sep 1, 2022
Sold by
Marcellus Crosslin
Bought by
Dad Properties Llc
Home Financials for this Owner
Home Financials are based on the most recent Mortgage that was taken out on this home.
Original Mortgage
$75,000
Interest Rate
5.3%
Mortgage Type
Construction
Purchase Details
Closed on
Feb 20, 2017
Sold by
Crosslin Faye
Bought by
Crosslin Mavecellus
Purchase Details
Closed on
Oct 17, 2008
Sold by
Crosslin Marcellos
Bought by
Crosslin Faye
Purchase Details
Closed on
Jun 27, 2006
Sold by
Crosslin Faye B
Bought by
Crosslin Marcellus
Create a Home Valuation Report for This Property
The Home Valuation Report is an in-depth analysis detailing your home's value as well as a comparison with similar homes in the area
Home Values in the Area
Average Home Value in this Area
Purchase History
| Date | Buyer | Sale Price | Title Company |
|---|---|---|---|
| Dad Properties Portfolio Vi Llc | -- | Near North Title Group | |
| Dad Properties Portfolio Vi Llc | -- | Near North Title Group | |
| Dad Properties Llc | -- | Near North Title Group | |
| Crosslin Mavecellus | -- | None Available | |
| Crosslin Faye | -- | None Available | |
| Crosslin Marcellus | -- | None Available |
Source: Public Records
Mortgage History
| Date | Status | Borrower | Loan Amount |
|---|---|---|---|
| Open | Dad Properties Portfolio Vi Llc | $3,415,500 | |
| Closed | Dad Properties Portfolio Vi Llc | $3,415,500 | |
| Previous Owner | Dad Properties Llc | $75,000 |
Source: Public Records
Tax History Compared to Growth
Tax History
| Year | Tax Paid | Tax Assessment Tax Assessment Total Assessment is a certain percentage of the fair market value that is determined by local assessors to be the total taxable value of land and additions on the property. | Land | Improvement |
|---|---|---|---|---|
| 2024 | $6,189 | $68,600 | $8,900 | $59,700 |
| 2023 | $1,770 | $70,200 | $12,000 | $58,200 |
| 2022 | $871 | $34,000 | $4,600 | $29,400 |
| 2021 | $804 | $31,400 | $4,600 | $26,800 |
| 2020 | $771 | $30,100 | $4,600 | $25,500 |
| 2019 | $693 | $30,000 | $2,200 | $27,800 |
| 2018 | $880 | $37,100 | $2,200 | $34,900 |
| 2017 | $60 | $41,200 | $2,200 | $39,000 |
| 2016 | $60 | $43,100 | $2,200 | $40,900 |
| 2014 | $22 | $49,200 | $2,700 | $46,500 |
| 2013 | $32 | $48,100 | $2,700 | $45,400 |
Source: Public Records
Map
Nearby Homes
- 1109 W 11th Ave
- 1040 Polk St
- 1141 Fillmore St
- 1052 Tyler St
- 823 Pierce St
- 817 Fillmore St
- 851 Johnson St
- 1072 Van Buren St
- 1165 Harrison St
- 743 Buchanan St
- 824 Johnson St
- 1123 - 1125 Van Buren St
- 1356 Johnson St
- 733 Lincoln St
- 1330 Van Buren St
- 1148 Jackson St
- 759 Grant St
- 1690 W 12th Ave
- 1005 Garfield St
- 1384 Harrison St
- 1048 Fillmore St
- 1041 Pierce St
- 1056 Fillmore St
- 1047 Pierce St
- 1060 Fillmore St
- 1049 Fillmore St
- 1055 Fillmore St
- 1064 Fillmore St
- 1061 Pierce St
- 1061 Fillmore St
- 1068 Fillmore St
- 1065 Fillmore St
- 1069 Pierce St
- 1072 Fillmore St
- 1044 Polk St
- 1048 Pierce St
- 1050 Polk St
- 1052 Pierce St
- 1073 Pierce St
- 1056 Polk St