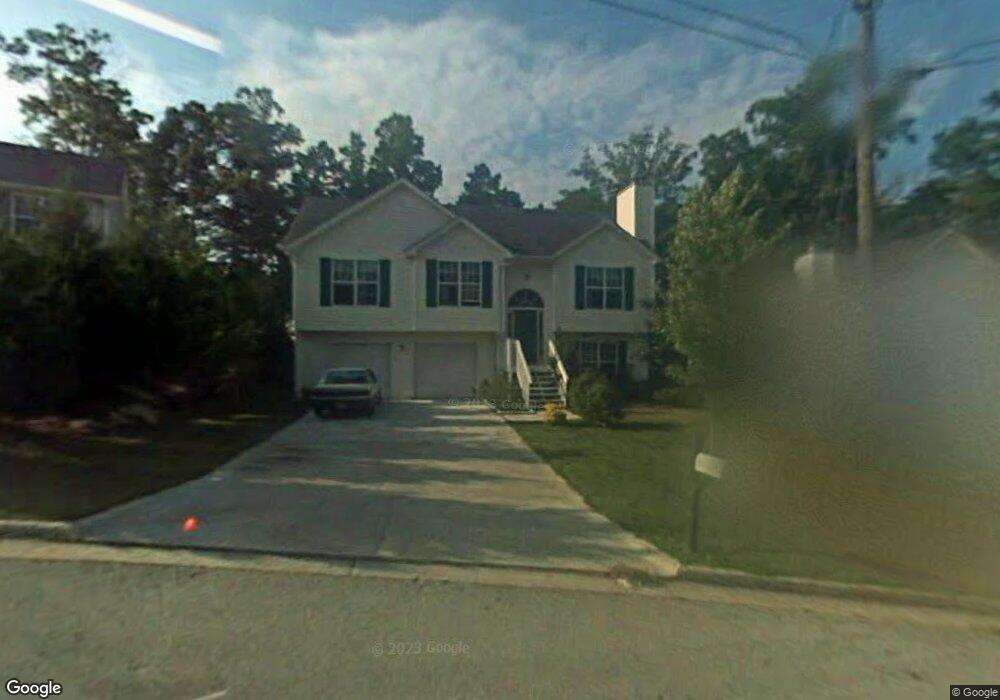
1036 Fishback Way Sugar Hill, GA 30518
Estimated Value: $341,000 - $364,000
4
Beds
2
Baths
1,633
Sq Ft
$219/Sq Ft
Est. Value
About This Home
This home is located at 1036 Fishback Way, Sugar Hill, GA 30518 and is currently estimated at $357,699, approximately $219 per square foot. 1036 Fishback Way is a home located in Gwinnett County with nearby schools including Sycamore Elementary School, Lanier Middle School, and Lanier High School.
Ownership History
Date
Name
Owned For
Owner Type
Purchase Details
Closed on
Aug 26, 2005
Sold by
Velasquez Jose E
Bought by
Enriquez Jesus
Current Estimated Value
Home Financials for this Owner
Home Financials are based on the most recent Mortgage that was taken out on this home.
Original Mortgage
$146,086
Outstanding Balance
$87,153
Interest Rate
7.95%
Mortgage Type
New Conventional
Estimated Equity
$270,546
Purchase Details
Closed on
Dec 3, 2001
Sold by
Rust Magda J
Bought by
Rust Bruve B and Rust Magda J
Home Financials for this Owner
Home Financials are based on the most recent Mortgage that was taken out on this home.
Original Mortgage
$132,815
Interest Rate
6.59%
Mortgage Type
FHA
Purchase Details
Closed on
Nov 16, 2001
Sold by
Rust Bruce B and Rust Magda J
Bought by
Velasquez Jose E
Home Financials for this Owner
Home Financials are based on the most recent Mortgage that was taken out on this home.
Original Mortgage
$132,815
Interest Rate
6.59%
Mortgage Type
FHA
Purchase Details
Closed on
Nov 25, 1998
Sold by
Denney Constr Co Inc
Bought by
Pennell Magda J
Home Financials for this Owner
Home Financials are based on the most recent Mortgage that was taken out on this home.
Original Mortgage
$109,890
Interest Rate
6.95%
Mortgage Type
FHA
Create a Home Valuation Report for This Property
The Home Valuation Report is an in-depth analysis detailing your home's value as well as a comparison with similar homes in the area
Home Values in the Area
Average Home Value in this Area
Purchase History
| Date | Buyer | Sale Price | Title Company |
|---|---|---|---|
| Enriquez Jesus | $153,800 | -- | |
| Rust Bruve B | -- | -- | |
| Velasquez Jose E | $134,900 | -- | |
| Pennell Magda J | $110,500 | -- |
Source: Public Records
Mortgage History
| Date | Status | Borrower | Loan Amount |
|---|---|---|---|
| Open | Enriquez Jesus | $146,086 | |
| Previous Owner | Velasquez Jose E | $132,815 | |
| Previous Owner | Pennell Magda J | $109,890 |
Source: Public Records
Tax History Compared to Growth
Tax History
| Year | Tax Paid | Tax Assessment Tax Assessment Total Assessment is a certain percentage of the fair market value that is determined by local assessors to be the total taxable value of land and additions on the property. | Land | Improvement |
|---|---|---|---|---|
| 2025 | $491 | $139,960 | $34,000 | $105,960 |
| 2024 | $3,458 | $137,160 | $26,400 | $110,760 |
| 2023 | $3,458 | $127,880 | $24,000 | $103,880 |
| 2022 | $3,220 | $124,960 | $20,000 | $104,960 |
| 2021 | $2,526 | $88,480 | $16,000 | $72,480 |
| 2020 | $2,726 | $81,120 | $12,800 | $68,320 |
| 2019 | $2,458 | $73,280 | $12,800 | $60,480 |
| 2018 | $2,322 | $67,560 | $12,800 | $54,760 |
| 2016 | $2,099 | $59,080 | $10,800 | $48,280 |
| 2015 | $1,544 | $44,240 | $6,800 | $37,440 |
| 2014 | $1,552 | $44,240 | $6,800 | $37,440 |
Source: Public Records
Map
Nearby Homes
- 1025 Hunters Oak Trail
- 978 Sugar Vista Cir
- 965 Sugar Meadow Dr
- 5605 Austin Garner Rd
- 1114 Danube Trail
- 5650 Princeton Oaks Dr
- 5680 Princeton Oaks Dr
- 1150 Sycamore Creek Trail
- 5557 Pinedale Cir
- 5660 Winter Bluff Way
- 5689 Winter Bluff Way
- 5671 Arbor Green Cir
- 1541 Autumn Wood Trail
- 5757 Riverside Dr Unit 2
- 915 Riverside Rd Unit 3
- 818 Pond View Ct
- 1230 Primrose Park Rd
- 5119 Princeton Oaks Ln
- 1046 Fishback Way Unit 4
- 1026 Fishback Way Unit 4
- 0 Princeton Oaks Ln Unit 7183543
- 0 Princeton Oaks Ln Unit 7492361
- 0 Princeton Oaks Ln Unit 7234605
- 0 Princeton Oaks Ln Unit 8290075
- 5424 Princeton Oaks Ln
- 5404 Princeton Oaks Ln
- 1056 Fishback Way Unit 4
- 1016 Fishback Way
- 1045 Hunters Oak Trail
- 1031 Fishback Way
- 1055 Hunters Oak Trail
- 1015 Hunters Oak Trail
- 5409 Princeton Oaks Ln
- 1011 Fishback Way Unit 4
- 1051 Fishback Way
- 5415 Princeton Oaks Dr
- 1066 Fishback Way