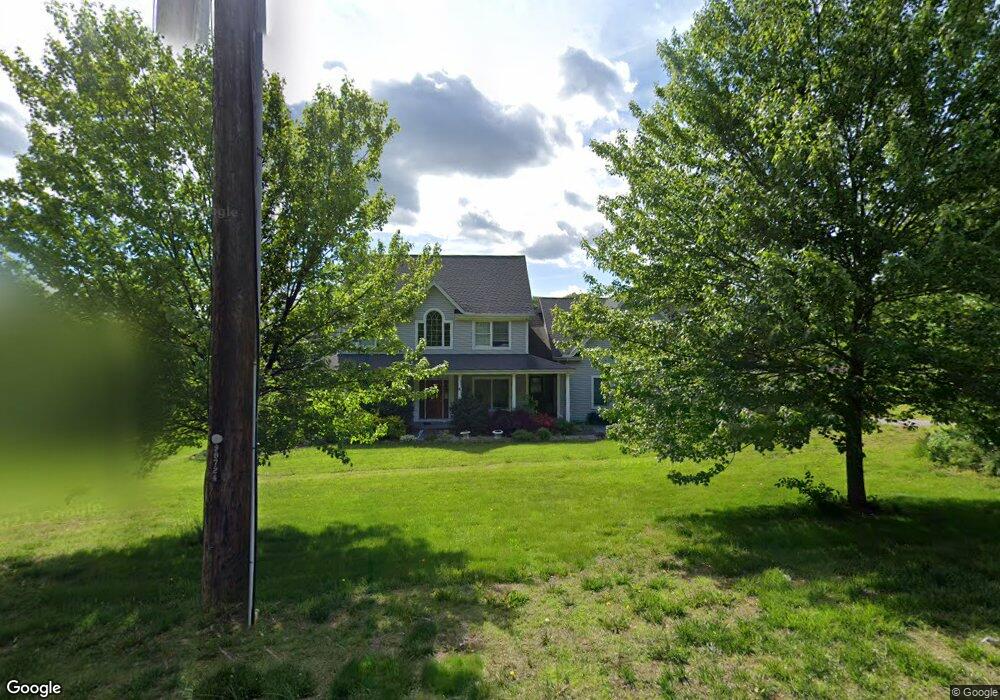
1036 Flanders Rd Southington, CT 06489
East Southington NeighborhoodEstimated Value: $756,092 - $873,000
4
Beds
3
Baths
3,654
Sq Ft
$226/Sq Ft
Est. Value
About This Home
This home is located at 1036 Flanders Rd, Southington, CT 06489 and is currently estimated at $826,523, approximately $226 per square foot. 1036 Flanders Rd is a home located in Hartford County with nearby schools including Reuben E. Thalberg Elementary School, Joseph A. Depaolo Middle School, and Southington High School.
Ownership History
Date
Name
Owned For
Owner Type
Purchase Details
Closed on
Sep 19, 2003
Sold by
Michel William
Bought by
Mackiewicz John and Mackiewicz Ann-Marie
Current Estimated Value
Home Financials for this Owner
Home Financials are based on the most recent Mortgage that was taken out on this home.
Original Mortgage
$300,000
Interest Rate
6%
Purchase Details
Closed on
Sep 24, 1999
Sold by
Est Telfer Elizabeth A and Oneil Bernard
Bought by
Michel Wilheim
Create a Home Valuation Report for This Property
The Home Valuation Report is an in-depth analysis detailing your home's value as well as a comparison with similar homes in the area
Home Values in the Area
Average Home Value in this Area
Purchase History
| Date | Buyer | Sale Price | Title Company |
|---|---|---|---|
| Mackiewicz John | $129,000 | -- | |
| Michel Wilheim | $71,000 | -- |
Source: Public Records
Mortgage History
| Date | Status | Borrower | Loan Amount |
|---|---|---|---|
| Open | Michel Wilheim | $436,000 | |
| Closed | Michel Wilheim | $300,000 |
Source: Public Records
Tax History Compared to Growth
Tax History
| Year | Tax Paid | Tax Assessment Tax Assessment Total Assessment is a certain percentage of the fair market value that is determined by local assessors to be the total taxable value of land and additions on the property. | Land | Improvement |
|---|---|---|---|---|
| 2025 | $11,906 | $358,510 | $70,880 | $287,630 |
| 2024 | $11,272 | $358,510 | $70,880 | $287,630 |
| 2023 | $10,884 | $358,510 | $70,880 | $287,630 |
| 2022 | $10,443 | $358,510 | $70,880 | $287,630 |
| 2021 | $10,408 | $358,510 | $70,880 | $287,630 |
| 2020 | $11,092 | $362,130 | $72,330 | $289,800 |
| 2019 | $11,096 | $362,130 | $72,330 | $289,800 |
| 2018 | $11,038 | $362,130 | $72,330 | $289,800 |
| 2017 | $11,038 | $362,130 | $72,330 | $289,800 |
| 2016 | $10,734 | $362,130 | $72,330 | $289,800 |
| 2015 | $10,539 | $361,670 | $68,890 | $292,780 |
| 2014 | $10,257 | $361,670 | $68,890 | $292,780 |
Source: Public Records
Map
Nearby Homes
- 922 Flanders Rd
- 19 Malcein Dr
- 228 Pattonwood Dr
- 185 Woodberry Hill Dr
- 23 Woodfield Rd
- 248 Annelise Ave
- 147 Rethal St
- 110 Rethal St
- 337 Flanders St
- 285 Queen St Unit 4B
- 90 Apple Gate Unit 77
- 90 Apple Gate Unit 188
- 90 Apple Gate Unit 186
- 273 Queen St Unit 9A
- 81 Laning St
- 138 Butler Ave
- 179 Sun Valley Dr
- 550 Darling St Unit 2A
- 152 Sun Valley Dr
- 4 Testa Dr
- 1016 Flanders Rd
- 1019 Flanders Rd
- 996 Flanders Rd
- 93 Old Cider Mill Rd
- 1005 Flanders Rd
- 995 Flanders Rd
- 1033 Flanders Rd
- 1043 Flanders Rd
- 101 Old Cider Mill Rd
- 983 Flanders Rd
- 1063 Flanders Rd
- 111 Old Cider Mill Rd
- 976 Flanders Rd
- 87 Old Cider Mill Rd
- 852 Laning St
- 1079 Flanders Rd
- 840 Laning St
- 973 Flanders Rd
- 75 Old Cider Mill Rd
- 822 Laning St