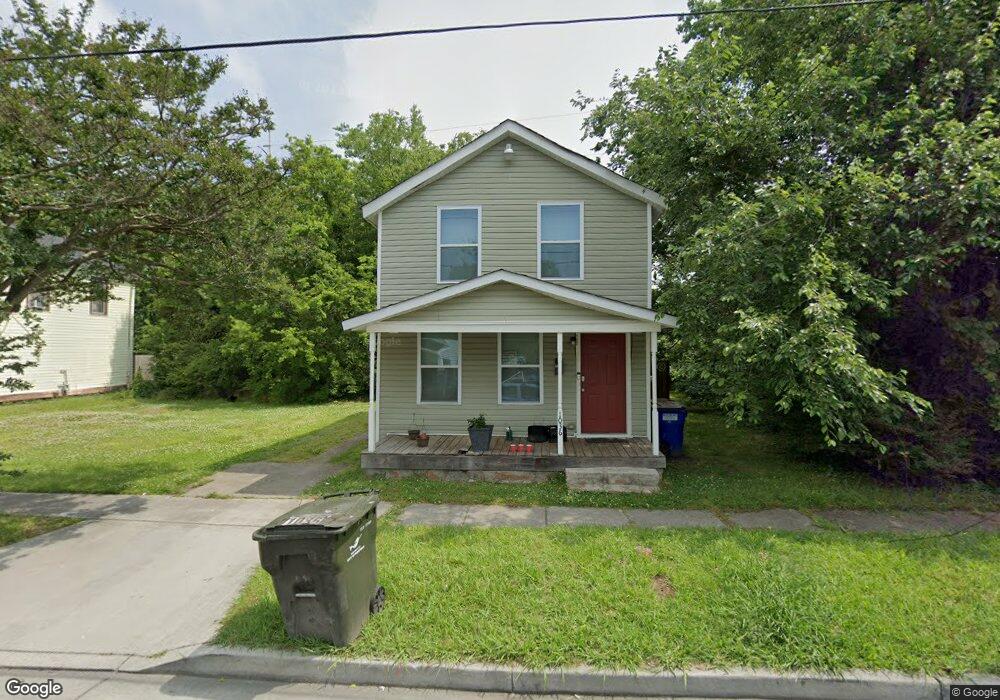
1036 Galt St Norfolk, VA 23504
Olde Huntersville NeighborhoodEstimated Value: $207,541 - $262,000
4
Beds
3
Baths
1,365
Sq Ft
$171/Sq Ft
Est. Value
About This Home
This home is located at 1036 Galt St, Norfolk, VA 23504 and is currently estimated at $233,135, approximately $170 per square foot. 1036 Galt St is a home located in Norfolk City with nearby schools including Jacox Elementary School, Blair Middle School, and Granby High School.
Ownership History
Date
Name
Owned For
Owner Type
Purchase Details
Closed on
Nov 19, 2018
Sold by
Hobbs Catherine A
Bought by
Brooks Donyale J
Current Estimated Value
Home Financials for this Owner
Home Financials are based on the most recent Mortgage that was taken out on this home.
Original Mortgage
$162,501
Outstanding Balance
$143,090
Interest Rate
4.87%
Mortgage Type
FHA
Estimated Equity
$90,045
Purchase Details
Closed on
Jul 31, 2017
Sold by
Lion House Investors Inc A Virignia Corp
Bought by
Hobbs Catherine A
Home Financials for this Owner
Home Financials are based on the most recent Mortgage that was taken out on this home.
Original Mortgage
$15,000
Interest Rate
3.9%
Mortgage Type
Unknown
Purchase Details
Closed on
Jan 26, 2017
Sold by
Bct Associates Llc A Virginia Limited Li
Bought by
Lion House Investors Inc A Virginia Corp
Purchase Details
Closed on
Feb 2, 2009
Sold by
Godsey Floyd
Bought by
Bct Associates Llc
Create a Home Valuation Report for This Property
The Home Valuation Report is an in-depth analysis detailing your home's value as well as a comparison with similar homes in the area
Home Values in the Area
Average Home Value in this Area
Purchase History
| Date | Buyer | Sale Price | Title Company |
|---|---|---|---|
| Brooks Donyale J | $165,500 | Attorney | |
| Hobbs Catherine A | $25,000 | Attorney | |
| Lion House Investors Inc A Virginia Corp | $10,500 | Attorney | |
| Bct Associates Llc | -- | None Available |
Source: Public Records
Mortgage History
| Date | Status | Borrower | Loan Amount |
|---|---|---|---|
| Open | Brooks Donyale J | $162,501 | |
| Previous Owner | Hobbs Catherine A | $15,000 |
Source: Public Records
Tax History Compared to Growth
Tax History
| Year | Tax Paid | Tax Assessment Tax Assessment Total Assessment is a certain percentage of the fair market value that is determined by local assessors to be the total taxable value of land and additions on the property. | Land | Improvement |
|---|---|---|---|---|
| 2025 | $2,199 | $175,900 | $29,500 | $146,400 |
| 2024 | $2,004 | $162,900 | $29,500 | $133,400 |
| 2023 | $1,949 | $155,900 | $29,500 | $126,400 |
| 2022 | $1,705 | $136,400 | $20,400 | $116,000 |
| 2021 | $1,539 | $123,100 | $18,700 | $104,400 |
| 2020 | $1,539 | $123,100 | $18,700 | $104,400 |
| 2019 | $1,376 | $110,100 | $18,700 | $91,400 |
| 2018 | $1,006 | $80,500 | $18,700 | $61,800 |
| 2017 | $918 | $79,800 | $18,700 | $61,100 |
| 2016 | $902 | $74,100 | $18,700 | $55,400 |
| 2015 | $852 | $74,100 | $18,700 | $55,400 |
| 2014 | $852 | $74,100 | $18,700 | $55,400 |
Source: Public Records
Map
Nearby Homes
- 1827 Carswell St
- 1825 Tidewater Dr
- 1815 Tidewater Dr
- 1814 Bracey St
- 2320 Ruffin St
- 1032 Anderson St
- 893 A Ave
- 896 A Ave
- 962 Saint Julian Ave
- 2408 Masi St
- 887 A Ave
- 1447 Dungee St
- 1005 Saint Julian Ave
- 1456 Calhoun St
- 1429 Chapel St
- 859 Lexington St
- 857 B Ave
- 934 Pollard St
- 835 Fremont St
- 833 Fremont St