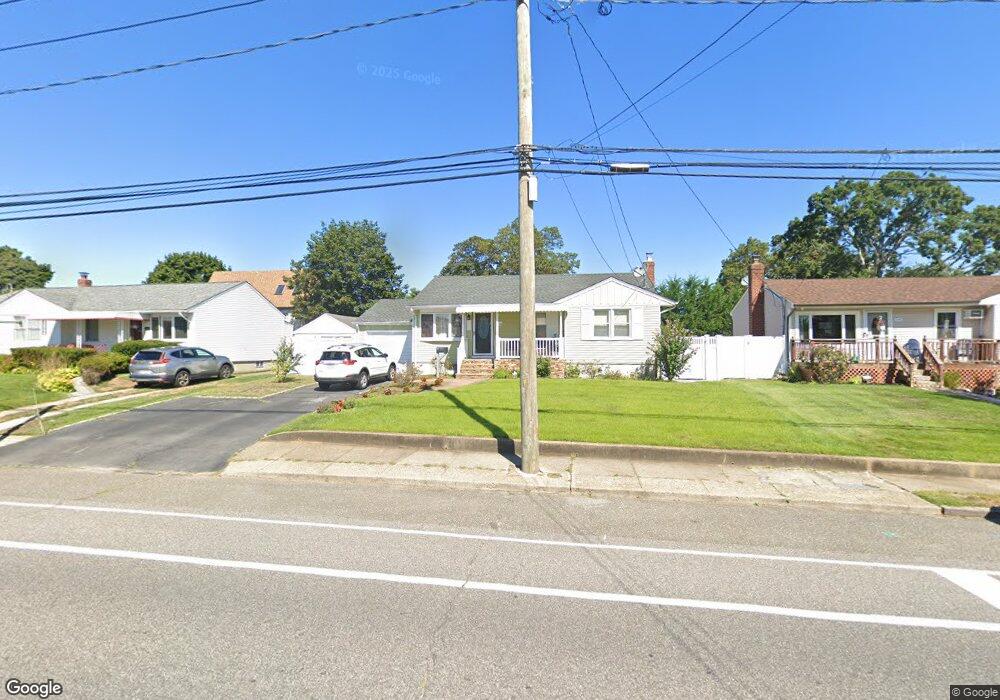
1036 Herzel Blvd West Babylon, NY 11704
Estimated Value: $498,000 - $648,000
Studio
--
Bath
962
Sq Ft
$598/Sq Ft
Est. Value
About This Home
This home is located at 1036 Herzel Blvd, West Babylon, NY 11704 and is currently estimated at $574,850, approximately $597 per square foot. 1036 Herzel Blvd is a home located in Suffolk County with nearby schools including West Babylon Senior High School.
Ownership History
Date
Name
Owned For
Owner Type
Purchase Details
Closed on
Sep 27, 2013
Sold by
Santoli Michael J and Santoli Concetta N
Bought by
Castillo Jose and Castillo Elenite
Current Estimated Value
Home Financials for this Owner
Home Financials are based on the most recent Mortgage that was taken out on this home.
Original Mortgage
$7,650
Outstanding Balance
$5,755
Interest Rate
4.53%
Mortgage Type
Unknown
Estimated Equity
$569,095
Purchase Details
Closed on
May 10, 2013
Sold by
Pocorobba Michael P and Pocorobba Louise A
Bought by
Pocorobba Michael P and Pocorobba Louise A
Create a Home Valuation Report for This Property
The Home Valuation Report is an in-depth analysis detailing your home's value as well as a comparison with similar homes in the area
Home Values in the Area
Average Home Value in this Area
Purchase History
| Date | Buyer | Sale Price | Title Company |
|---|---|---|---|
| Castillo Jose | $255,000 | -- | |
| Pocorobba Michael P | -- | -- |
Source: Public Records
Mortgage History
| Date | Status | Borrower | Loan Amount |
|---|---|---|---|
| Open | Castillo Jose | $7,650 | |
| Open | Castillo Jose | $242,250 |
Source: Public Records
Tax History
| Year | Tax Paid | Tax Assessment Tax Assessment Total Assessment is a certain percentage of the fair market value that is determined by local assessors to be the total taxable value of land and additions on the property. | Land | Improvement |
|---|---|---|---|---|
| 2024 | $10,023 | $2,970 | $240 | $2,730 |
| 2023 | $10,023 | $2,970 | $240 | $2,730 |
| 2022 | $8,383 | $2,970 | $240 | $2,730 |
| 2021 | $8,383 | $2,970 | $240 | $2,730 |
| 2020 | $8,701 | $2,970 | $240 | $2,730 |
| 2019 | $8,701 | $0 | $0 | $0 |
| 2018 | $8,256 | $2,970 | $240 | $2,730 |
| 2017 | $8,256 | $2,970 | $240 | $2,730 |
| 2016 | $8,247 | $2,970 | $240 | $2,730 |
| 2015 | -- | $2,970 | $240 | $2,730 |
| 2014 | -- | $2,970 | $240 | $2,730 |
Source: Public Records
Map
Nearby Homes
Your Personal Tour Guide
Ask me questions while you tour the home.