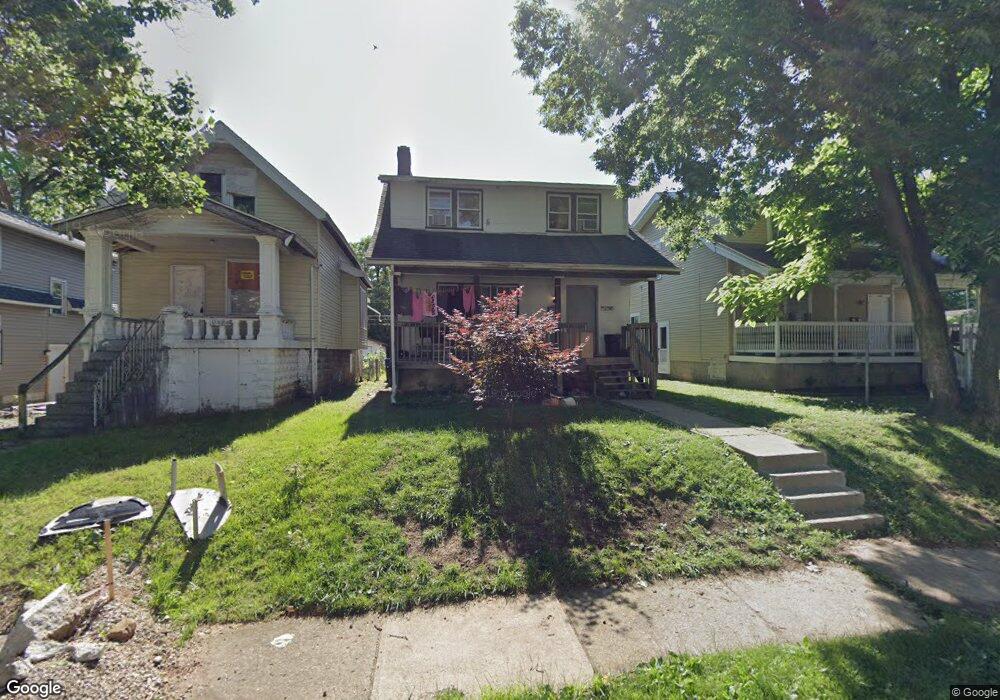
1036 Miller Ave Columbus, OH 43206
Driving Park NeighborhoodEstimated Value: $215,000 - $256,000
3
Beds
2
Baths
1,505
Sq Ft
$160/Sq Ft
Est. Value
About This Home
This home is located at 1036 Miller Ave, Columbus, OH 43206 and is currently estimated at $240,990, approximately $160 per square foot. 1036 Miller Ave is a home located in Franklin County with nearby schools including Fairwood Alternative Elementary School, South High School, and Capital Collegiate Preparatory Academy.
Ownership History
Date
Name
Owned For
Owner Type
Purchase Details
Closed on
May 10, 2024
Sold by
Baldwin Investments Llc
Bought by
C & L Inv Properties Llc
Current Estimated Value
Purchase Details
Closed on
Feb 28, 2024
Sold by
Chenault Raymond
Bought by
Baldwin Investments Llc
Purchase Details
Closed on
Feb 12, 2024
Sold by
Chenault Raymond
Bought by
Baldwin Investments Llc
Purchase Details
Closed on
Apr 11, 2003
Sold by
Naumoff Properties Llc
Bought by
Chenault Raymond
Home Financials for this Owner
Home Financials are based on the most recent Mortgage that was taken out on this home.
Original Mortgage
$71,100
Interest Rate
5.76%
Purchase Details
Closed on
Mar 4, 2003
Sold by
Equicredit Corp Of Ohio
Bought by
Fv-1 Inc
Home Financials for this Owner
Home Financials are based on the most recent Mortgage that was taken out on this home.
Original Mortgage
$71,100
Interest Rate
5.76%
Purchase Details
Closed on
Apr 29, 2002
Sold by
Burney Helen M and Burney Helen M
Bought by
Equicredit Corp Of Ohio
Purchase Details
Closed on
Nov 3, 1992
Bought by
Burney Helen M
Purchase Details
Closed on
May 5, 1992
Purchase Details
Closed on
May 1, 1980
Create a Home Valuation Report for This Property
The Home Valuation Report is an in-depth analysis detailing your home's value as well as a comparison with similar homes in the area
Home Values in the Area
Average Home Value in this Area
Purchase History
| Date | Buyer | Sale Price | Title Company |
|---|---|---|---|
| C & L Inv Properties Llc | $110,000 | Landsel Title Agency | |
| Baldwin Investments Llc | $40,900 | Valmer Land Title | |
| Baldwin Investments Llc | $40,900 | Valmer Land Title | |
| Chenault Raymond | $79,000 | Esquire Title | |
| Fv-1 Inc | $19,000 | -- | |
| Equicredit Corp Of Ohio | $18,000 | -- | |
| Burney Helen M | $39,000 | -- | |
| -- | $18,800 | -- | |
| -- | $17,000 | -- |
Source: Public Records
Mortgage History
| Date | Status | Borrower | Loan Amount |
|---|---|---|---|
| Previous Owner | Chenault Raymond | $71,100 |
Source: Public Records
Tax History Compared to Growth
Tax History
| Year | Tax Paid | Tax Assessment Tax Assessment Total Assessment is a certain percentage of the fair market value that is determined by local assessors to be the total taxable value of land and additions on the property. | Land | Improvement |
|---|---|---|---|---|
| 2024 | $2,444 | $54,460 | $10,220 | $44,240 |
| 2023 | $2,413 | $54,460 | $10,220 | $44,240 |
| 2022 | $842 | $16,240 | $2,310 | $13,930 |
| 2021 | $844 | $16,240 | $2,310 | $13,930 |
| 2020 | $845 | $16,240 | $2,310 | $13,930 |
| 2019 | $816 | $13,450 | $1,930 | $11,520 |
| 2018 | $783 | $13,450 | $1,930 | $11,520 |
| 2017 | $822 | $13,450 | $1,930 | $11,520 |
| 2016 | $828 | $12,500 | $2,700 | $9,800 |
| 2015 | $752 | $12,500 | $2,700 | $9,800 |
| 2014 | $754 | $12,500 | $2,700 | $9,800 |
| 2013 | $437 | $14,700 | $3,185 | $11,515 |
Source: Public Records
Map
Nearby Homes
- 1021-1023 Miller Ave
- 1337 E Kossuth St Unit 1339
- 993 Miller Ave Unit 995
- 954 Miller Ave
- 980 Miller Ave
- 1025 Lockbourne Rd Unit 27
- 959 Kelton Ave
- 928 Miller Ave
- 991 Lilley Ave
- 1005 Studer Ave
- 901 Miller Ave
- 961 Lilley Ave
- 910 Ellsworth Ave
- 1095 Berkeley Rd
- 1417 E Whittier St
- 1060-1062 Linwood Ave
- 1144 E Whittier St
- 889 Kelton Ave
- 1184-1186 Lilley Ave
- 1345 E Livingston Ave Unit 1347
- 1032 Miller Ave
- 1040 Miller Ave
- 1028 Miller Ave
- 1322 E Kossuth St
- 1024 Miller Ave
- 1326 E Kossuth St
- 1020 Miller Ave
- 1296 E Kossuth St
- 1029 Ellsworth Ave Unit 31
- 1054 Miller Ave
- 1330 E Kossuth St Unit 332
- 1330-1332 E Kossuth St
- 1014 Miller Ave Unit 16
- 1014 Miller Ave
- 1014 Miller Ave Unit 14 - 16
- 1014-1016 Miller Ave
- 1025-1027 Miller Ave
- 1016 Miller Ave Unit 1016 Miller
- 1031 Miller Ave
- 1321 E Kossuth St