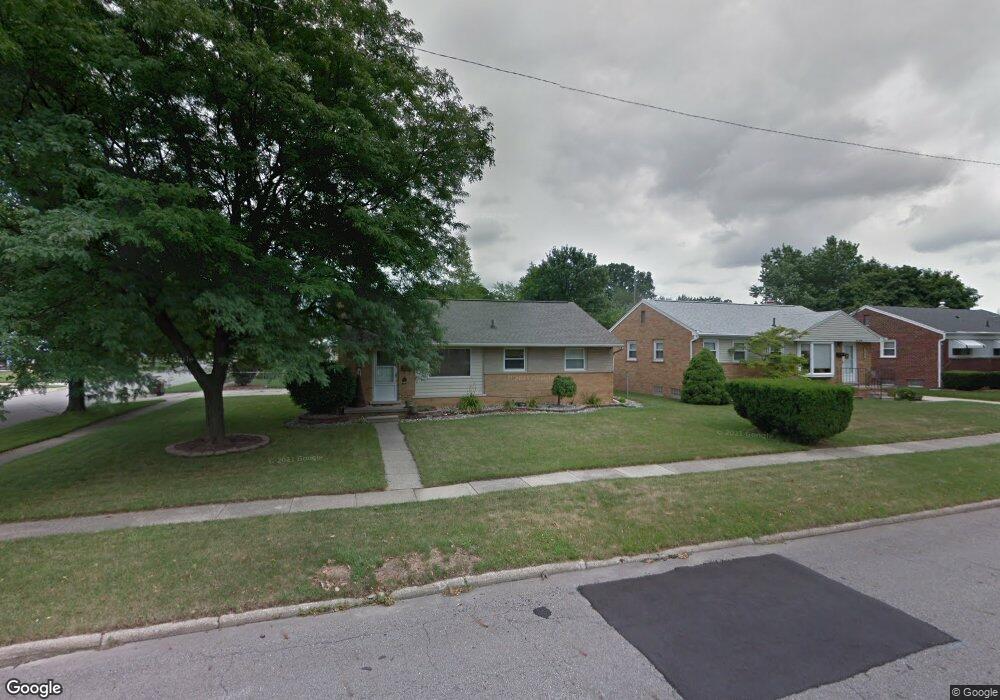
1036 Morris Ave Lansing Mi Null Lansing, MI
Edgemont Park NeighborhoodEstimated Value: $192,000 - $225,000
4
Beds
2
Baths
1,064
Sq Ft
$194/Sq Ft
Est. Value
About This Home
This home is located at 1036 Morris Ave Lansing Mi Null, Lansing, MI and is currently estimated at $206,209, approximately $193 per square foot. 1036 Morris Ave Lansing Mi Null is a home located in Ingham County with nearby schools including Waverly Senior High School, Windemere Park Charter Academy, and St. Gerard Elementary School.
Ownership History
Date
Name
Owned For
Owner Type
Purchase Details
Closed on
Dec 15, 2017
Sold by
Vandlen Nathanael C and Vandlen Lauren R
Bought by
Hernandez Christy
Current Estimated Value
Home Financials for this Owner
Home Financials are based on the most recent Mortgage that was taken out on this home.
Original Mortgage
$114,363
Outstanding Balance
$96,284
Interest Rate
3.94%
Mortgage Type
New Conventional
Estimated Equity
$109,925
Purchase Details
Closed on
Apr 6, 2005
Sold by
Folkert Charlotte D
Bought by
Vandlen Nathanael C and Vandlen Lauren R
Home Financials for this Owner
Home Financials are based on the most recent Mortgage that was taken out on this home.
Original Mortgage
$134,500
Interest Rate
5.88%
Mortgage Type
Fannie Mae Freddie Mac
Purchase Details
Closed on
Nov 7, 2001
Sold by
Folkert Charlotte D
Bought by
Folkert Charlotte D
Purchase Details
Closed on
Jul 6, 1998
Sold by
Lawrence Patrick G and Lawrence Rhonda
Bought by
Folkert Lynn A
Purchase Details
Closed on
May 18, 1994
Create a Home Valuation Report for This Property
The Home Valuation Report is an in-depth analysis detailing your home's value as well as a comparison with similar homes in the area
Home Values in the Area
Average Home Value in this Area
Purchase History
| Date | Buyer | Sale Price | Title Company |
|---|---|---|---|
| Hernandez Christy | $117,900 | None Available | |
| Vandlen Nathanael C | $134,500 | Fatic | |
| Folkert Charlotte D | -- | -- | |
| Folkert Lynn A | $85,000 | -- | |
| -- | $76,800 | -- |
Source: Public Records
Mortgage History
| Date | Status | Borrower | Loan Amount |
|---|---|---|---|
| Open | Hernandez Christy | $114,363 | |
| Previous Owner | Vandlen Nathanael C | $134,500 |
Source: Public Records
Tax History Compared to Growth
Tax History
| Year | Tax Paid | Tax Assessment Tax Assessment Total Assessment is a certain percentage of the fair market value that is determined by local assessors to be the total taxable value of land and additions on the property. | Land | Improvement |
|---|---|---|---|---|
| 2025 | $3,389 | $83,100 | $27,200 | $55,900 |
| 2024 | $3,285 | $76,700 | $21,700 | $55,000 |
| 2023 | $3,285 | $67,100 | $21,000 | $46,100 |
| 2022 | $3,144 | $62,900 | $20,400 | $42,500 |
| 2021 | $3,081 | $60,100 | $17,000 | $43,100 |
| 2020 | $2,854 | $54,800 | $17,000 | $37,800 |
| 2019 | $2,788 | $50,100 | $11,900 | $38,200 |
| 2018 | $2,785 | $46,600 | $10,500 | $36,100 |
| 2017 | $3,154 | $46,600 | $10,500 | $36,100 |
| 2016 | -- | $46,600 | $9,800 | $36,800 |
| 2015 | -- | $47,000 | $19,684 | $27,316 |
| 2014 | -- | $45,600 | $16,969 | $28,631 |
Source: Public Records
Map
Nearby Homes
- 3333 W Willow St
- 3435 Hagan St
- 1222 Ravenswood Dr
- 3316 W Willow St
- 3322 Pickwick Place
- 3014 Timber Dr
- 3001 Risley Dr
- 3502 Springbrook Ln
- 2817 W Willow St
- 1610 Ravenswood Dr
- 1920 Briarwood Dr
- 1805 Boynton Dr
- 515 N Grace St
- 240 N Deerfield Ave
- 0000 N Dibble Ave
- 4120 Arlene Dr
- 2123 Cogswell Dr
- 2206 Kuerbitz Dr
- 914 Stanley St
- 2300 Byrnes Rd