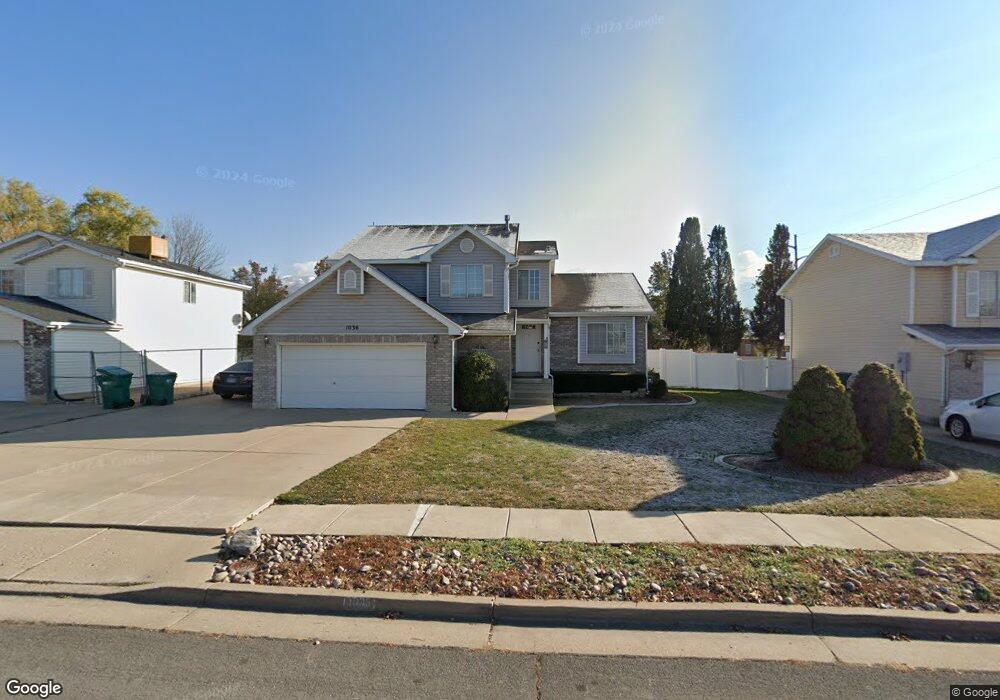
1036 N 175 E Layton, UT 84041
Estimated Value: $484,246 - $514,000
4
Beds
4
Baths
1,968
Sq Ft
$253/Sq Ft
Est. Value
About This Home
This home is located at 1036 N 175 E, Layton, UT 84041 and is currently estimated at $498,812, approximately $253 per square foot. 1036 N 175 E is a home located in Davis County with nearby schools including King Elementary School, Central Davis Junior High School, and Northridge High School.
Ownership History
Date
Name
Owned For
Owner Type
Purchase Details
Closed on
Dec 8, 2004
Sold by
Robb Robert R and Robb Hyonae
Bought by
Brigman Tok Sun
Current Estimated Value
Purchase Details
Closed on
Jan 24, 2002
Sold by
Robb Hyonae and Robb Robert R
Bought by
Robb Robert R and Robb Hyonae
Home Financials for this Owner
Home Financials are based on the most recent Mortgage that was taken out on this home.
Original Mortgage
$109,900
Interest Rate
6.59%
Create a Home Valuation Report for This Property
The Home Valuation Report is an in-depth analysis detailing your home's value as well as a comparison with similar homes in the area
Home Values in the Area
Average Home Value in this Area
Purchase History
| Date | Buyer | Sale Price | Title Company |
|---|---|---|---|
| Brigman Tok Sun | -- | Bonneville Title Company | |
| Robb Robert R | -- | Associated Title Company |
Source: Public Records
Mortgage History
| Date | Status | Borrower | Loan Amount |
|---|---|---|---|
| Previous Owner | Robb Robert R | $109,900 |
Source: Public Records
Tax History
| Year | Tax Paid | Tax Assessment Tax Assessment Total Assessment is a certain percentage of the fair market value that is determined by local assessors to be the total taxable value of land and additions on the property. | Land | Improvement |
|---|---|---|---|---|
| 2025 | $2,363 | $248,050 | $87,766 | $160,284 |
| 2024 | $2,257 | $238,700 | $102,202 | $136,498 |
| 2023 | $2,248 | $419,000 | $120,914 | $298,086 |
| 2022 | $2,331 | $235,950 | $64,105 | $171,845 |
| 2021 | $2,127 | $321,000 | $90,387 | $230,613 |
| 2020 | $1,927 | $279,000 | $75,858 | $203,142 |
| 2019 | $1,882 | $267,000 | $71,869 | $195,131 |
| 2018 | $1,721 | $245,000 | $71,869 | $173,131 |
| 2016 | $1,637 | $120,230 | $27,162 | $93,068 |
| 2015 | $1,551 | $108,185 | $27,162 | $81,023 |
| 2014 | $1,666 | $118,809 | $27,162 | $91,647 |
| 2013 | -- | $100,238 | $26,884 | $73,354 |
Source: Public Records
Map
Nearby Homes
- 965 Amethyst St
- 1085 N 125 E
- 84 E Diamond St
- 126 E 1150 N
- 975 N Garnet St
- 103 E 1250 N
- 1096 N 300 W
- 227 E 1500 N
- 1148 N 350 W
- 22 E 525 N
- 34 E 525 N
- 1571 N 160 W
- 489 Owens St
- 350 Church St
- 789 N Hill Villa Dr
- 14 W Belvedere Way
- 1683 N 250 W
- 861 E 575 N
- 556 N Fairfield Rd Unit A2
- 556 N Fairfield Rd Unit D1
Your Personal Tour Guide
Ask me questions while you tour the home.