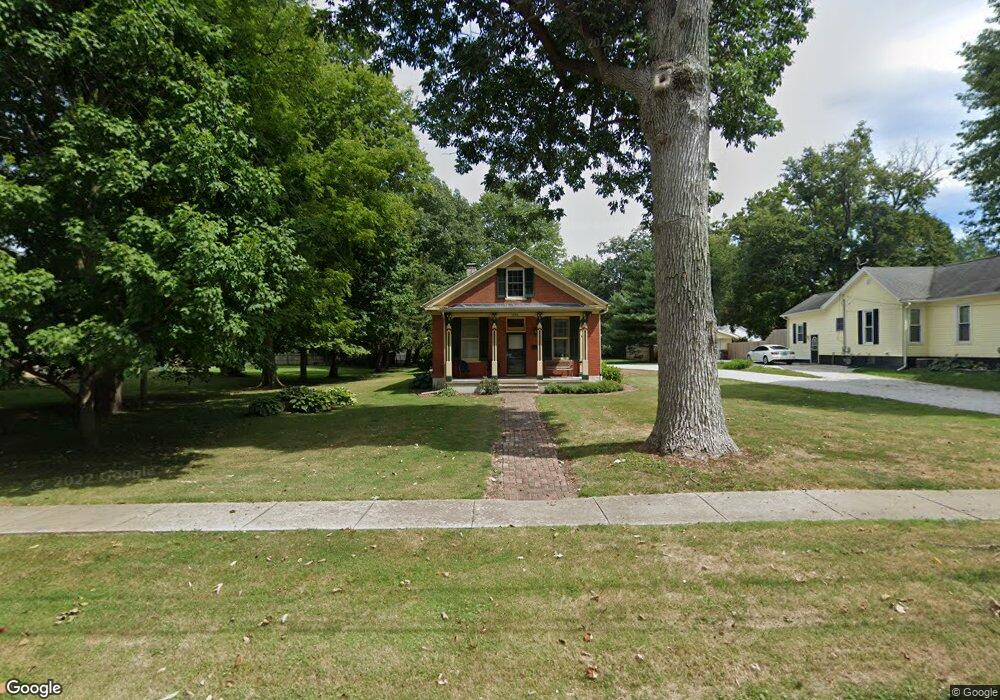
1036 S Clay Ave Jacksonville, IL 62650
Estimated Value: $137,000 - $156,000
3
Beds
1
Bath
1,720
Sq Ft
$84/Sq Ft
Est. Value
About This Home
This home is located at 1036 S Clay Ave, Jacksonville, IL 62650 and is currently estimated at $143,713, approximately $83 per square foot. 1036 S Clay Ave is a home located in Morgan County with nearby schools including Jacksonville High School, Salem Lutheran School, and Salem Lutheran School.
Ownership History
Date
Name
Owned For
Owner Type
Purchase Details
Closed on
Jun 24, 2010
Sold by
Hill Christopher M and Hill Mary Louise
Bought by
Keown Becki D and Ebken Mary K
Current Estimated Value
Home Financials for this Owner
Home Financials are based on the most recent Mortgage that was taken out on this home.
Original Mortgage
$35,000
Interest Rate
4.23%
Mortgage Type
New Conventional
Purchase Details
Closed on
Oct 31, 2006
Sold by
Hill Michael A and Hill Toni
Bought by
Hill Christopher M and Guthrie Mary S
Home Financials for this Owner
Home Financials are based on the most recent Mortgage that was taken out on this home.
Original Mortgage
$17,600
Interest Rate
6%
Mortgage Type
Stand Alone Second
Purchase Details
Closed on
Sep 8, 2002
Sold by
Mason Harlan O Barbara Joann
Bought by
Hill Michael A Toni
Create a Home Valuation Report for This Property
The Home Valuation Report is an in-depth analysis detailing your home's value as well as a comparison with similar homes in the area
Home Values in the Area
Average Home Value in this Area
Purchase History
| Date | Buyer | Sale Price | Title Company |
|---|---|---|---|
| Keown Becki D | $110,000 | None Available | |
| Hill Christopher M | $29,333 | None Available | |
| Hill Michael A Toni | $60,000 | -- |
Source: Public Records
Mortgage History
| Date | Status | Borrower | Loan Amount |
|---|---|---|---|
| Closed | Keown Becki D | $35,000 | |
| Previous Owner | Hill Christopher M | $17,600 | |
| Previous Owner | Hill Christopher M | $70,300 |
Source: Public Records
Tax History Compared to Growth
Tax History
| Year | Tax Paid | Tax Assessment Tax Assessment Total Assessment is a certain percentage of the fair market value that is determined by local assessors to be the total taxable value of land and additions on the property. | Land | Improvement |
|---|---|---|---|---|
| 2024 | $2,817 | $44,550 | $6,130 | $38,420 |
| 2023 | $2,816 | $38,450 | $6,130 | $32,320 |
| 2022 | $2,817 | $35,570 | $6,130 | $29,440 |
| 2021 | $3,214 | $40,460 | $8,340 | $32,120 |
| 2020 | $3,292 | $40,460 | $8,340 | $32,120 |
| 2019 | $3,269 | $40,460 | $8,340 | $32,120 |
| 2018 | $3,111 | $40,140 | $8,340 | $31,800 |
| 2017 | $3,043 | $40,140 | $8,340 | $31,800 |
| 2016 | $3,074 | $40,140 | $8,340 | $31,800 |
| 2015 | $3,030 | $38,970 | $8,100 | $30,870 |
| 2014 | $3,030 | $38,970 | $8,100 | $30,870 |
| 2013 | $2,758 | $43,600 | $8,100 | $35,500 |
Source: Public Records
Map
Nearby Homes
- 727 Hardin Ave
- 900 Bibbs St
- 333 Kentucky St
- 306 E Michigan Ave
- 800 S Main St
- 544 Hardin Ave
- 352 Franklin St
- 107 E Michigan Ave
- 729 S West St
- 1434 S East St
- 1509 Hardin Ave
- 205 E Pennsylvania Ave
- 227 Anna St
- 406 S East St
- 440 S Sandy St
- 401 S East St
- 209 E Beecher Ave
- 1612 Elmwood St
- None None St
- 1660 Elmwood St
- 1042 S Clay Ave
- 1024 S Clay Ave
- 1016 S Clay Ave
- 917 Goltra Ave
- 919 Goltra Ave
- 915 Goltra Ave
- 1056 S Clay Ave
- 1012 S Clay Ave
- 1027 S Clay Ave
- 923 Goltra Ave
- 1045 S Clay Ave
- 1006 S Clay Ave
- 403 E Morton Ave
- 1023 S Clay Ave
- 925 Goltra Ave
- 1060 S Clay Ave
- 1017 S Clay Ave
- 1055 S Clay Ave
- 927 Goltra Ave
- 1049 S Clay Ave