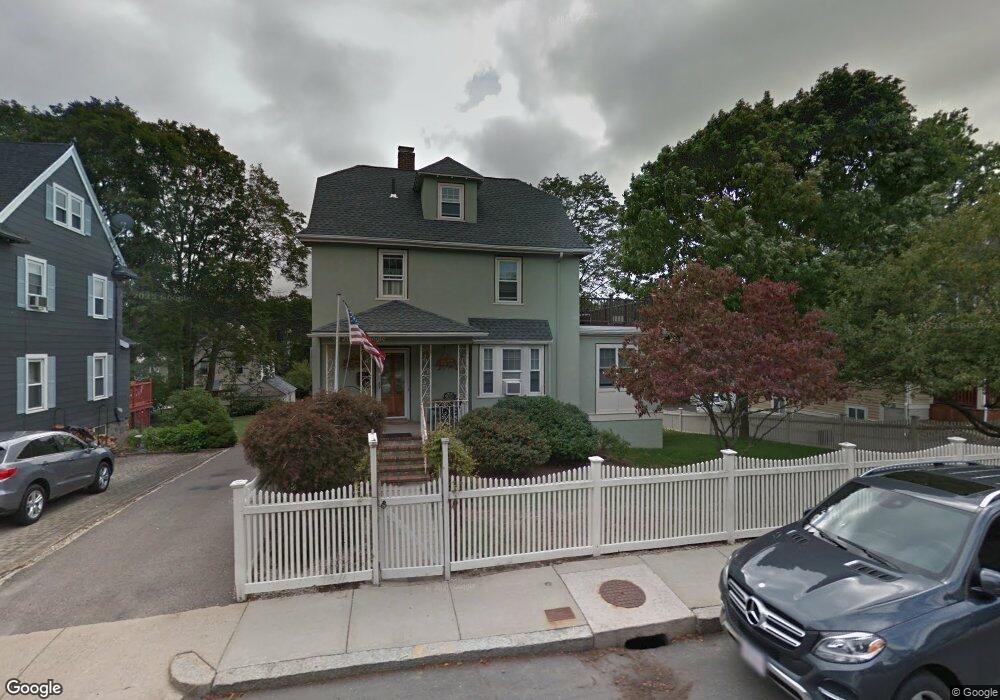
1036 South St Roslindale, MA 02131
Roslindale NeighborhoodEstimated Value: $840,000 - $1,076,000
4
Beds
2
Baths
1,870
Sq Ft
$503/Sq Ft
Est. Value
About This Home
This home is located at 1036 South St, Roslindale, MA 02131 and is currently estimated at $941,293, approximately $503 per square foot. 1036 South St is a home located in Suffolk County with nearby schools including Brooke Charter School Roslindale, Holy Name Parish School, and St. Clare High School.
Ownership History
Date
Name
Owned For
Owner Type
Purchase Details
Closed on
Jun 29, 1998
Sold by
Lacoretz Daniel A and Furman Jill P
Bought by
Gearin Michael L and Gearin Eileen P
Current Estimated Value
Purchase Details
Closed on
Dec 29, 1995
Sold by
Brown Gerard and Brown Cheryl
Bought by
Lacoretz Daniel A and Furman Jill P
Purchase Details
Closed on
Apr 11, 1994
Sold by
Hanson William O
Bought by
Brown Gerard and Brown Cheryl
Create a Home Valuation Report for This Property
The Home Valuation Report is an in-depth analysis detailing your home's value as well as a comparison with similar homes in the area
Home Values in the Area
Average Home Value in this Area
Purchase History
| Date | Buyer | Sale Price | Title Company |
|---|---|---|---|
| Gearin Michael L | $235,000 | -- | |
| Lacoretz Daniel A | $165,000 | -- | |
| Brown Gerard | $116,000 | -- |
Source: Public Records
Mortgage History
| Date | Status | Borrower | Loan Amount |
|---|---|---|---|
| Open | Brown Gerard | $250,000 | |
| Closed | Brown Gerard | $260,000 |
Source: Public Records
Tax History Compared to Growth
Tax History
| Year | Tax Paid | Tax Assessment Tax Assessment Total Assessment is a certain percentage of the fair market value that is determined by local assessors to be the total taxable value of land and additions on the property. | Land | Improvement |
|---|---|---|---|---|
| 2025 | $9,303 | $803,400 | $292,800 | $510,600 |
| 2024 | $8,052 | $738,700 | $251,900 | $486,800 |
| 2023 | $7,934 | $738,700 | $251,900 | $486,800 |
| 2022 | $7,176 | $659,600 | $224,900 | $434,700 |
| 2021 | $6,863 | $643,200 | $224,900 | $418,300 |
| 2020 | $5,988 | $567,000 | $208,000 | $359,000 |
| 2019 | $5,540 | $525,600 | $177,600 | $348,000 |
| 2018 | $5,103 | $486,900 | $177,600 | $309,300 |
| 2017 | $5,156 | $486,900 | $177,600 | $309,300 |
| 2016 | $5,200 | $472,700 | $177,600 | $295,100 |
| 2015 | $5,062 | $418,000 | $159,800 | $258,200 |
| 2014 | $4,520 | $359,300 | $139,500 | $219,800 |
Source: Public Records
Map
Nearby Homes
- 257 Belgrade Ave
- 242 Belgrade Ave
- 311 Belgrade Ave
- 26 Bradfield Ave Unit 3
- 15 Newburg St Unit 1
- 59 Aldrich St Unit 2
- 95 Newburg St
- 17 Metcalf St
- 103 Belgrade Ave Unit 2
- 79 Robert St Unit 3
- 416 Belgrade Ave Unit 25
- 10 Burwell Rd
- 112 Roslindale Ave Unit 2
- 80 Roslindale Ave Unit 3
- 15 S Fairview St Unit 3
- 142 Birch St
- 142 Birch St Unit 1
- 142 Birch St Unit 2
- 276 Cornell St
- 152 Stratford St
- 1032 South St
- 1028 South St
- 105 Tyndale St
- 1044 South St
- 1044 South St Unit 2
- 1044 South St Unit 1
- 101 Tyndale St
- 113 Tyndale St
- 97 Tyndale St
- 1024 South St Unit 2
- 1024 South St Unit 1
- 1021 South St
- 1029 South St
- 117 Tyndale St
- 1019 South St
- 93 Tyndale St
- 93 Tyndale St Unit 2
- 1020 South St
- 1052 South St Unit 3
- 1052 South St Unit 2