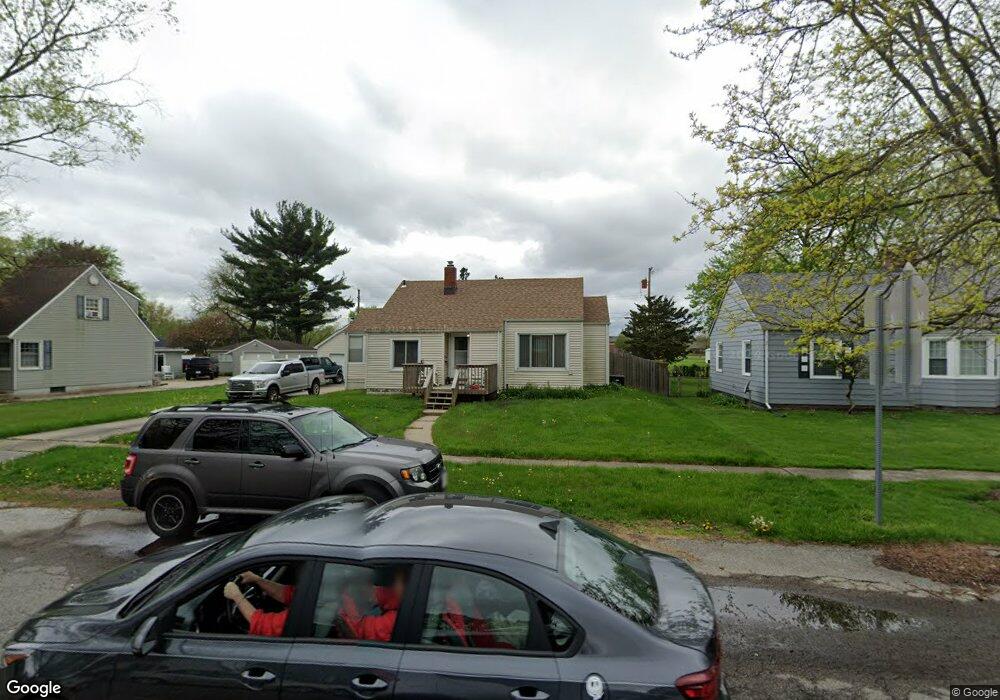
1036 State St Hobart, IN 46342
Estimated Value: $231,646 - $262,000
3
Beds
2
Baths
1,377
Sq Ft
$184/Sq Ft
Est. Value
About This Home
This home is located at 1036 State St, Hobart, IN 46342 and is currently estimated at $253,162, approximately $183 per square foot. 1036 State St is a home located in Lake County with nearby schools including Hobart High School, Trinity Lutheran School, and Hobart Baptist School.
Ownership History
Date
Name
Owned For
Owner Type
Purchase Details
Closed on
Jul 23, 2010
Sold by
Dunn Wanda Sue
Bought by
Dunn Wanda Sue and Dunn Angela M
Current Estimated Value
Home Financials for this Owner
Home Financials are based on the most recent Mortgage that was taken out on this home.
Original Mortgage
$132,219
Outstanding Balance
$88,464
Interest Rate
5.25%
Mortgage Type
FHA
Estimated Equity
$164,698
Purchase Details
Closed on
Jun 3, 2010
Sold by
Cleary James A and Cleary Nora I
Bought by
Dunn Wanda S
Home Financials for this Owner
Home Financials are based on the most recent Mortgage that was taken out on this home.
Original Mortgage
$132,219
Outstanding Balance
$88,464
Interest Rate
5.25%
Mortgage Type
FHA
Estimated Equity
$164,698
Create a Home Valuation Report for This Property
The Home Valuation Report is an in-depth analysis detailing your home's value as well as a comparison with similar homes in the area
Home Values in the Area
Average Home Value in this Area
Purchase History
| Date | Buyer | Sale Price | Title Company |
|---|---|---|---|
| Dunn Wanda Sue | -- | None Available | |
| Dunn Wanda S | -- | Community Title Company |
Source: Public Records
Mortgage History
| Date | Status | Borrower | Loan Amount |
|---|---|---|---|
| Open | Dunn Wanda S | $132,219 |
Source: Public Records
Tax History
| Year | Tax Paid | Tax Assessment Tax Assessment Total Assessment is a certain percentage of the fair market value that is determined by local assessors to be the total taxable value of land and additions on the property. | Land | Improvement |
|---|---|---|---|---|
| 2025 | $2,607 | $245,300 | $48,900 | $196,400 |
| 2024 | $8,038 | $224,200 | $48,900 | $175,300 |
| 2023 | $2,330 | $196,900 | $42,400 | $154,500 |
| 2022 | $2,330 | $194,900 | $42,400 | $152,500 |
| 2021 | $2,023 | $169,000 | $32,600 | $136,400 |
| 2020 | $1,934 | $162,200 | $32,600 | $129,600 |
| 2019 | $2,082 | $156,700 | $32,600 | $124,100 |
| 2018 | $2,081 | $146,900 | $32,600 | $114,300 |
| 2017 | $1,924 | $135,000 | $32,600 | $102,400 |
| 2016 | $1,879 | $136,100 | $32,600 | $103,500 |
| 2014 | $1,703 | $133,700 | $32,600 | $101,100 |
| 2013 | $1,545 | $125,700 | $32,600 | $93,100 |
Source: Public Records
Map
Nearby Homes
- 241 E 11th Place
- 915 Paula Ct
- 1229 State St
- 1075-1085 S Lake Park Ave
- 217 E 13th Place
- 201 E 13th Place
- 753 Fleming St
- 723 Lincoln St
- 727 Water St
- 717 Lake St
- 812 S Lake Park Ave
- 1359 State St
- 239 Laura Ln
- 1348 S Illinois St
- 652 S State St
- 1446 Lake St
- 1450 Lake St
- 811 Henry Ct
- 1210 S Ash St
- 1226 S Ash St
Your Personal Tour Guide
Ask me questions while you tour the home.