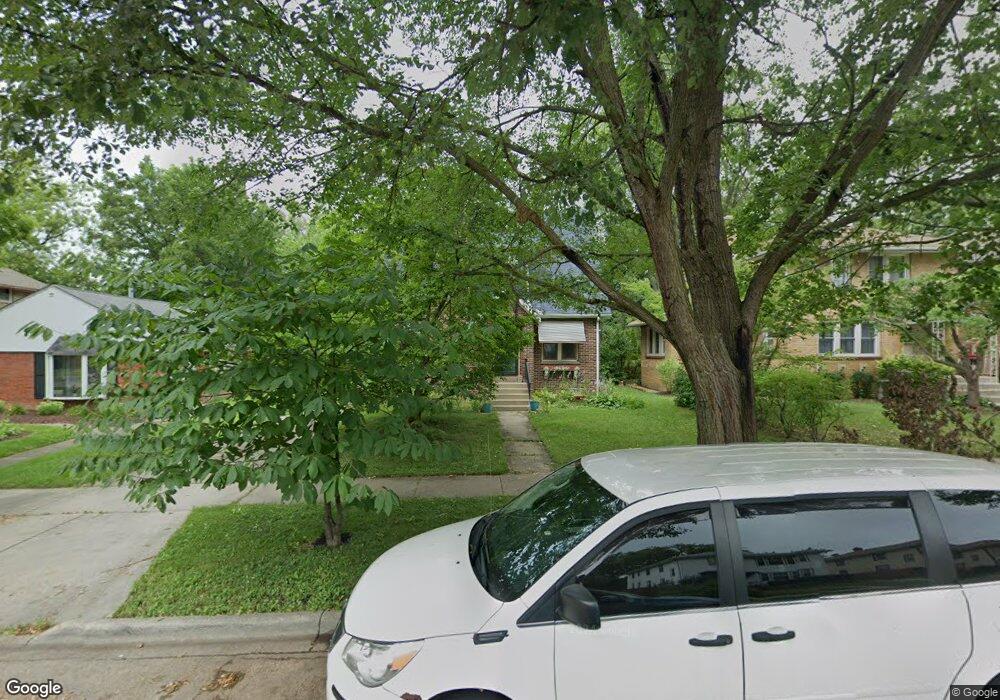
1036 W Pacific Ave Waukegan, IL 60085
Estimated Value: $248,000 - $305,000
3
Beds
2
Baths
1,800
Sq Ft
$150/Sq Ft
Est. Value
About This Home
This home is located at 1036 W Pacific Ave, Waukegan, IL 60085 and is currently estimated at $270,821, approximately $150 per square foot. 1036 W Pacific Ave is a home located in Lake County with nearby schools including Glen Flora Elementary School, Edith M Smith Middle School, and Waukegan High School.
Ownership History
Date
Name
Owned For
Owner Type
Purchase Details
Closed on
Nov 21, 2008
Sold by
Wiesel Sean S and Wiedel Victoria J
Bought by
Creath Jeffrey A
Current Estimated Value
Home Financials for this Owner
Home Financials are based on the most recent Mortgage that was taken out on this home.
Original Mortgage
$110,000
Outstanding Balance
$73,619
Interest Rate
6.48%
Mortgage Type
Purchase Money Mortgage
Estimated Equity
$197,202
Purchase Details
Closed on
Oct 25, 2001
Sold by
Wiedel Sean S
Bought by
Wiedel Sean S and Wiedel Victoria J
Purchase Details
Closed on
May 27, 1999
Sold by
Berdux Dorothy M
Bought by
Wiedel Sean S
Home Financials for this Owner
Home Financials are based on the most recent Mortgage that was taken out on this home.
Original Mortgage
$105,600
Interest Rate
6.99%
Create a Home Valuation Report for This Property
The Home Valuation Report is an in-depth analysis detailing your home's value as well as a comparison with similar homes in the area
Home Values in the Area
Average Home Value in this Area
Purchase History
| Date | Buyer | Sale Price | Title Company |
|---|---|---|---|
| Creath Jeffrey A | $175,000 | Attorneys Title Guaranty Fun | |
| Wiedel Sean S | -- | -- | |
| Wiedel Sean S | $132,000 | -- |
Source: Public Records
Mortgage History
| Date | Status | Borrower | Loan Amount |
|---|---|---|---|
| Open | Creath Jeffrey A | $110,000 | |
| Previous Owner | Wiedel Sean S | $105,600 |
Source: Public Records
Tax History Compared to Growth
Tax History
| Year | Tax Paid | Tax Assessment Tax Assessment Total Assessment is a certain percentage of the fair market value that is determined by local assessors to be the total taxable value of land and additions on the property. | Land | Improvement |
|---|---|---|---|---|
| 2024 | $4,763 | $64,878 | $11,777 | $53,101 |
| 2023 | $4,907 | $58,512 | $10,621 | $47,891 |
| 2022 | $4,907 | $56,196 | $11,341 | $44,855 |
| 2021 | $4,607 | $50,192 | $10,116 | $40,076 |
| 2020 | $4,620 | $46,760 | $9,424 | $37,336 |
| 2019 | $4,597 | $42,848 | $8,636 | $34,212 |
| 2018 | $4,414 | $40,523 | $12,224 | $28,299 |
| 2017 | $4,278 | $35,852 | $10,815 | $25,037 |
| 2016 | $3,887 | $31,154 | $9,398 | $21,756 |
| 2015 | $3,697 | $27,883 | $8,411 | $19,472 |
| 2014 | $3,357 | $25,379 | $5,950 | $19,429 |
| 2012 | $4,380 | $27,496 | $6,446 | $21,050 |
Source: Public Records
Map
Nearby Homes
- 1018 W Atlantic Ave
- 1312 N Linden Ave
- 1335 Chestnut St
- 1336 N Ash St
- 1105 Woodlawn Cir
- 1504 W Glen Flora Ave
- 616 W Keith Ave
- 1905 Linden Ave
- 1117 Judge Ave
- 1110 N Ash St
- 1000 Pine St
- 917 N Linden Ave
- 1038 Indiana Ave
- 1109 Massena Ave
- 918 N Ash St
- 1023 N Elmwood Ave
- 12787 W Grove Ave
- 824 N Butrick St
- 2008 Harding Ave
- 2009 Harding Ave
- 1040 W Pacific Ave
- 1030 W Pacific Ave
- 1026 W Pacific Ave
- 1102 W Pacific Ave
- 1022 W Pacific Ave
- 1511 Western Ave
- 1106 W Pacific Ave
- 1515 Western Ave
- 1018 W Pacific Ave
- 1519 Western Ave
- 1033 W Atlantic Ave
- 1523 Western Ave
- 1037 W Atlantic Ave
- 1014 W Pacific Ave
- 1029 W Atlantic Ave
- 1025 W Atlantic Ave
- 1101 W Pacific Ave
- 1021 W Atlantic Ave
- 1105 W Pacific Ave
- 1027 W Pacific Ave