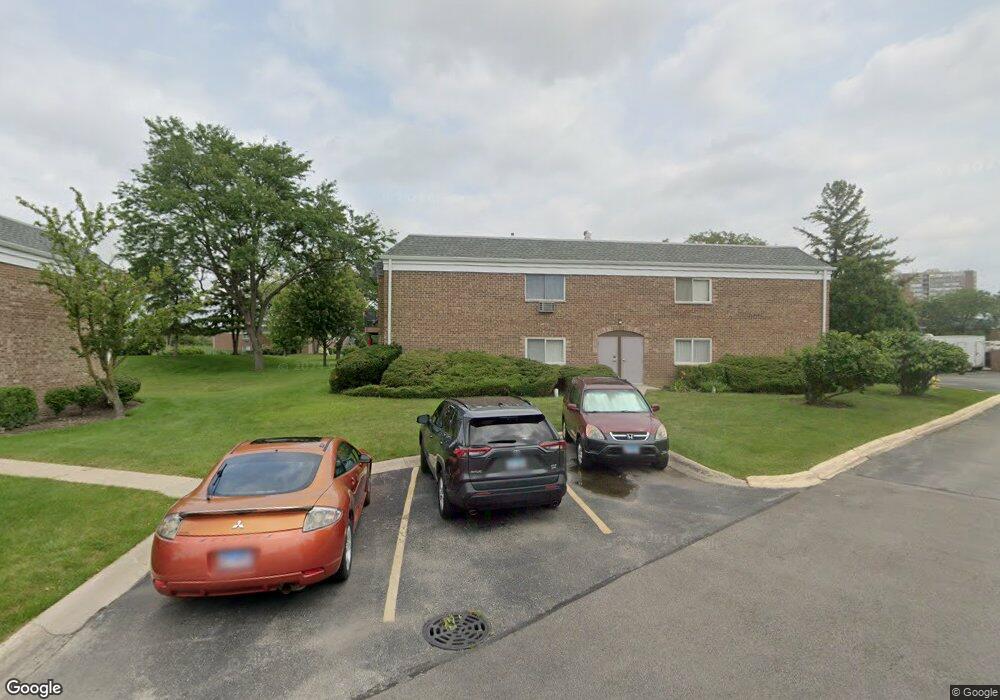
10361 Dearlove Rd Unit 9207 Glenview, IL 60025
Estimated Value: $217,000 - $281,000
2
Beds
--
Bath
203,056
Sq Ft
$1/Sq Ft
Est. Value
About This Home
This home is located at 10361 Dearlove Rd Unit 9207, Glenview, IL 60025 and is currently estimated at $245,546, approximately $1 per square foot. 10361 Dearlove Rd Unit 9207 is a home located in Cook County with nearby schools including Westbrook Elementary School, Glen Grove Elementary School, and Springman Middle School.
Ownership History
Date
Name
Owned For
Owner Type
Purchase Details
Closed on
Dec 7, 2018
Sold by
Shah Nirali
Bought by
Bpsz Real Estate Enterprises Llc
Current Estimated Value
Purchase Details
Closed on
Oct 22, 2018
Sold by
Siegel Ronald R and Siegel Sr Revocable L Ronald R
Bought by
Shah Nirali
Purchase Details
Closed on
Jan 5, 2016
Sold by
Siegel Ronald and Siegel Carolyn
Bought by
Siegel Ronald R and Siegel Sr Revocable L Ronald R
Purchase Details
Closed on
Apr 14, 2000
Sold by
Kim Dong Ho
Bought by
Kim Je Woong and Kim Hee Jin
Home Financials for this Owner
Home Financials are based on the most recent Mortgage that was taken out on this home.
Original Mortgage
$96,000
Interest Rate
8.29%
Purchase Details
Closed on
Jan 27, 1995
Sold by
Ho Kim In Kap and Ho Kim Dong
Bought by
Kim Dong Ho
Create a Home Valuation Report for This Property
The Home Valuation Report is an in-depth analysis detailing your home's value as well as a comparison with similar homes in the area
Home Values in the Area
Average Home Value in this Area
Purchase History
| Date | Buyer | Sale Price | Title Company |
|---|---|---|---|
| Bpsz Real Estate Enterprises Llc | -- | Attorney | |
| Shah Nirali | $160,000 | Landtrust National Title | |
| Siegel Ronald R | -- | None Available | |
| Kim Je Woong | $120,000 | Chicago Title Insurance Co | |
| Kim Dong Ho | -- | -- |
Source: Public Records
Mortgage History
| Date | Status | Borrower | Loan Amount |
|---|---|---|---|
| Previous Owner | Kim Je Woong | $96,000 |
Source: Public Records
Tax History Compared to Growth
Tax History
| Year | Tax Paid | Tax Assessment Tax Assessment Total Assessment is a certain percentage of the fair market value that is determined by local assessors to be the total taxable value of land and additions on the property. | Land | Improvement |
|---|---|---|---|---|
| 2024 | $3,842 | $16,327 | $1,147 | $15,180 |
| 2023 | $2,864 | $16,327 | $1,147 | $15,180 |
| 2022 | $2,864 | $16,327 | $1,147 | $15,180 |
| 2021 | $2,631 | $13,502 | $781 | $12,721 |
| 2020 | $2,673 | $13,502 | $781 | $12,721 |
| 2019 | $2,505 | $14,965 | $781 | $14,184 |
| 2018 | $1,305 | $8,814 | $677 | $8,137 |
| 2017 | $1,283 | $8,814 | $677 | $8,137 |
| 2016 | $1,404 | $8,814 | $677 | $8,137 |
| 2015 | $1,101 | $7,052 | $547 | $6,505 |
| 2014 | $1,091 | $7,052 | $547 | $6,505 |
| 2013 | $1,045 | $7,052 | $547 | $6,505 |
Source: Public Records
Map
Nearby Homes
- 10373 Dearlove Rd Unit 4E
- 4150 Central Rd Unit 3E
- 3925 Triumvera Dr Unit 14D
- 4170 Cove Ln Unit 2B
- 701 Forum Square Unit 609
- 4146 Cove Ln Unit D
- 10430 Michael Todd Terrace
- 600 Naples Ct Unit 107
- 600 Naples Ct Unit 608
- 4128 Cove Ln Unit C
- 3841 Appian Way Unit T17B
- 3845 Appian Way Unit T17D
- 10151 Meadow Ln
- 3732 Capri Ct Unit T18A
- 9517 W Central Rd
- 4106 Cove Ln Unit A
- 9411 Harrison St Unit 471494
- 1026 Castilian Ct Unit D162
- 1026 Castilian Ct Unit 104
- 491 Leslie Ct Unit 201
- 10361 Dearlove Rd Unit 2G
- 10361 Dearlove Rd Unit 2B
- 10361 Dearlove Rd Unit 9104
- 10361 Dearlove Rd Unit 9211
- 10361 Dearlove Rd Unit 9210
- 10361 Dearlove Rd Unit 9202
- 10361 Dearlove Rd Unit 9103
- 10361 Dearlove Rd Unit 9208
- 10361 Dearlove Rd Unit 9201
- 10361 Dearlove Rd Unit 9204
- 10361 Dearlove Rd Unit 9110
- 10361 Dearlove Rd Unit 9102
- 10361 Dearlove Rd Unit 9105
- 10361 Dearlove Rd Unit 9108
- 10361 Dearlove Rd Unit 9206
- 10361 Dearlove Rd Unit 9101
- 10361 Dearlove Rd Unit 9106
- 10361 Dearlove Rd Unit 9109
- 10361 Dearlove Rd Unit 9107
- 10361 Dearlove Rd Unit 9209