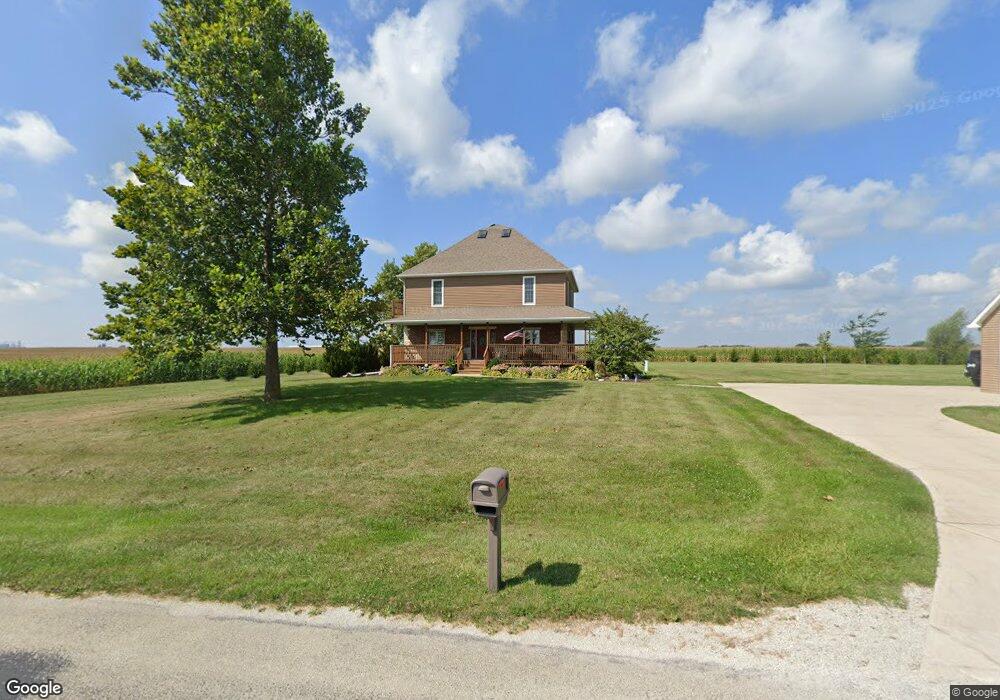
10361 N 3100 East Rd Chatsworth, IL 60921
Estimated Value: $264,000 - $383,841
3
Beds
1
Bath
2,664
Sq Ft
$115/Sq Ft
Est. Value
About This Home
This home is located at 10361 N 3100 East Rd, Chatsworth, IL 60921 and is currently estimated at $307,460, approximately $115 per square foot. 10361 N 3100 East Rd is a home located in Livingston County with nearby schools including Prairie Central High School.
Ownership History
Date
Name
Owned For
Owner Type
Purchase Details
Closed on
Jan 5, 2021
Sold by
Zimmerman Pete R and Zimmerman Jolene K
Bought by
Miller Seth and Miller Courtney
Current Estimated Value
Home Financials for this Owner
Home Financials are based on the most recent Mortgage that was taken out on this home.
Original Mortgage
$196,000
Outstanding Balance
$174,931
Interest Rate
2.71%
Mortgage Type
New Conventional
Estimated Equity
$132,529
Purchase Details
Closed on
Aug 9, 2016
Sold by
Klepczarek Nicole and Klepczarek Richard E
Bought by
Zimmerman Jolene K and Zimmerman Peter R
Home Financials for this Owner
Home Financials are based on the most recent Mortgage that was taken out on this home.
Original Mortgage
$130,000
Interest Rate
3%
Mortgage Type
Future Advance Clause Open End Mortgage
Create a Home Valuation Report for This Property
The Home Valuation Report is an in-depth analysis detailing your home's value as well as a comparison with similar homes in the area
Home Values in the Area
Average Home Value in this Area
Purchase History
| Date | Buyer | Sale Price | Title Company |
|---|---|---|---|
| Miller Seth | $245,000 | None Available | |
| Zimmerman Jolene K | $220,000 | None Available |
Source: Public Records
Mortgage History
| Date | Status | Borrower | Loan Amount |
|---|---|---|---|
| Open | Miller Seth | $196,000 | |
| Previous Owner | Zimmerman Jolene K | $130,000 |
Source: Public Records
Tax History Compared to Growth
Tax History
| Year | Tax Paid | Tax Assessment Tax Assessment Total Assessment is a certain percentage of the fair market value that is determined by local assessors to be the total taxable value of land and additions on the property. | Land | Improvement |
|---|---|---|---|---|
| 2024 | $8,106 | $101,271 | $8,876 | $92,395 |
| 2023 | $6,692 | $82,905 | $8,069 | $74,836 |
| 2022 | $5,927 | $72,701 | $7,834 | $64,867 |
| 2021 | $5,475 | $68,328 | $7,363 | $60,965 |
| 2020 | $5,265 | $65,074 | $7,012 | $58,062 |
| 2019 | $5,326 | $65,074 | $7,012 | $58,062 |
| 2018 | $4,758 | $57,826 | $8,696 | $49,130 |
| 2017 | $3,612 | $44,931 | $8,443 | $36,488 |
| 2016 | $4,089 | $43,622 | $8,197 | $35,425 |
| 2015 | $3,823 | $40,541 | $7,618 | $32,923 |
| 2013 | $4,201 | $43,355 | $7,712 | $35,643 |
Source: Public Records
Map
Nearby Homes
- 407 E Pine St
- 7691 N 3000 East Rd
- 506 E Spruce St
- 0 Reni Ct Unit MAR24068745
- 206 E Oak St
- 510 E Elm St
- 402 S 4th St
- 322 E Watson St
- 306 E Martin St
- 313 E Orchard St
- 105 W Martin St
- 316 W John St
- 700 E North St
- 4043 N 3000 East Rd
- 126 E Cleveland St
- 214 S Lansdale St
- 10 E Piper City St
- 14 W Market St
- 205 E Jeffery St
- 100 E Market St