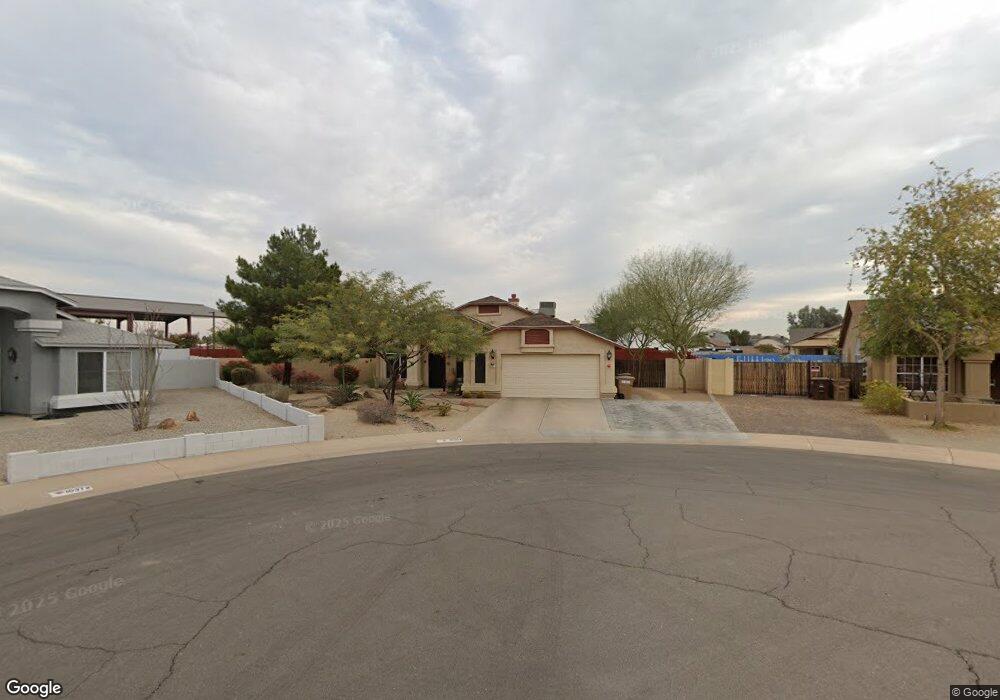
10363 N 78th Dr Peoria, AZ 85345
Estimated Value: $380,504 - $487,000
--
Bed
3
Baths
1,818
Sq Ft
$250/Sq Ft
Est. Value
About This Home
This home is located at 10363 N 78th Dr, Peoria, AZ 85345 and is currently estimated at $455,376, approximately $250 per square foot. 10363 N 78th Dr is a home located in Maricopa County with nearby schools including Santa Fe Elementary School, Peoria High School, and Academy of Math and Science - Peoria Advanced.
Ownership History
Date
Name
Owned For
Owner Type
Purchase Details
Closed on
Jul 12, 2005
Sold by
Weidman Robert C
Bought by
Pavich Steven J and Diaz Pavich Angelica M
Current Estimated Value
Home Financials for this Owner
Home Financials are based on the most recent Mortgage that was taken out on this home.
Original Mortgage
$216,800
Outstanding Balance
$112,367
Interest Rate
5.55%
Mortgage Type
New Conventional
Estimated Equity
$343,009
Purchase Details
Closed on
Aug 13, 2003
Sold by
Weidman Janet L
Bought by
Weidman Robert C
Purchase Details
Closed on
Nov 2, 1998
Sold by
Weidman Robert C
Bought by
Weidman Robert C and Weidman Janet L
Home Financials for this Owner
Home Financials are based on the most recent Mortgage that was taken out on this home.
Original Mortgage
$92,000
Interest Rate
6.61%
Create a Home Valuation Report for This Property
The Home Valuation Report is an in-depth analysis detailing your home's value as well as a comparison with similar homes in the area
Home Values in the Area
Average Home Value in this Area
Purchase History
| Date | Buyer | Sale Price | Title Company |
|---|---|---|---|
| Pavich Steven J | $271,000 | Westland Title Agency Of Az | |
| Weidman Robert C | -- | -- | |
| Weidman Robert C | -- | Old Republic Title Agency |
Source: Public Records
Mortgage History
| Date | Status | Borrower | Loan Amount |
|---|---|---|---|
| Open | Pavich Steven J | $216,800 | |
| Previous Owner | Weidman Robert C | $92,000 | |
| Closed | Pavich Steven J | $27,100 |
Source: Public Records
Tax History Compared to Growth
Tax History
| Year | Tax Paid | Tax Assessment Tax Assessment Total Assessment is a certain percentage of the fair market value that is determined by local assessors to be the total taxable value of land and additions on the property. | Land | Improvement |
|---|---|---|---|---|
| 2025 | $1,093 | $14,035 | -- | -- |
| 2024 | $1,076 | $13,367 | -- | -- |
| 2023 | $1,076 | $30,570 | $6,110 | $24,460 |
| 2022 | $1,054 | $23,100 | $4,620 | $18,480 |
| 2021 | $1,128 | $21,310 | $4,260 | $17,050 |
| 2020 | $1,139 | $19,460 | $3,890 | $15,570 |
| 2019 | $1,102 | $17,850 | $3,570 | $14,280 |
| 2018 | $1,065 | $17,570 | $3,510 | $14,060 |
| 2017 | $1,066 | $14,650 | $2,930 | $11,720 |
| 2016 | $1,055 | $14,610 | $2,920 | $11,690 |
| 2015 | $985 | $13,050 | $2,610 | $10,440 |
Source: Public Records
Map
Nearby Homes
- 7726 W Cheryl Dr
- 7810 W Peoria Ave Unit 166
- 7810 W Peoria Ave Unit 74
- 7810 W Peoria Ave Unit 121
- 7810 W Peoria Ave Unit 98
- 7810 W Peoria Ave Unit 152
- 7810 W Peoria Ave Unit 85
- 7810 W Peoria Ave Unit 79
- 7810 W Peoria Ave Unit 174
- 116XX N 80th Ave Unit 16
- 11817 N 80th Ave Unit 2
- 10955 N 79th Ave Unit 147
- 10955 N 79th Ave Unit 60
- 10955 N 79th Ave Unit 113
- 10955 N 79th Ave Unit 163
- 10955 N 79th Ave Unit 179
- 10955 N 79th Ave Unit 40
- 7508 W Beryl Ave
- 8105 W Peoria Ave
- 8211 W Madison St
- 10372 N 78th Dr
- 10355 N 78th Dr
- 10352 N 78th Ave
- 10347 N 78th Dr
- 10364 N 78th Dr
- 10366 N 78th Ave
- 10346 N 78th Ave
- 10356 N 78th Dr
- 10348 N 78th Dr
- 10359 N 78th Ave
- 10353 N 78th Ave
- 10340 N 78th Dr
- 7825 W Comet Ave
- 7817 W Comet Ave
- 10347 N 78th Ave
- 7809 W Comet Ave
- 7801 W Comet Ave
- 10332 N 78th Dr
- 7733 W Cochise Dr
- 7734 W Cochise Dr