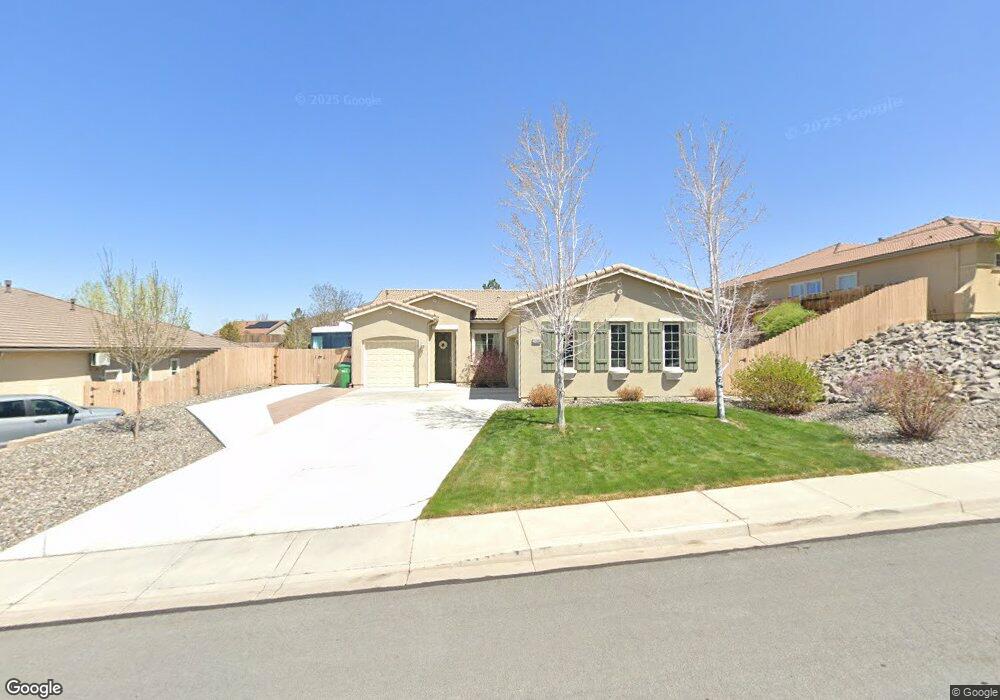
10365 Cavalry Cir Reno, NV 89521
Virginia Foothills NeighborhoodEstimated Value: $782,948 - $849,000
3
Beds
2
Baths
1,904
Sq Ft
$423/Sq Ft
Est. Value
About This Home
This home is located at 10365 Cavalry Cir, Reno, NV 89521 and is currently estimated at $806,237, approximately $423 per square foot. 10365 Cavalry Cir is a home with nearby schools including Jwood Raw Elementary School, Kendyl Depoali Middle School, and Damonte Ranch High School.
Ownership History
Date
Name
Owned For
Owner Type
Purchase Details
Closed on
Apr 9, 2018
Sold by
Griswodl Joan K and Shahbaghlian Gail K
Bought by
Griswold John K and Shahbaghlian Gail K
Current Estimated Value
Purchase Details
Closed on
Mar 25, 2013
Sold by
Br Catron Llc
Bought by
Griswold Joan K and Shahbaghlian Gail K
Home Financials for this Owner
Home Financials are based on the most recent Mortgage that was taken out on this home.
Original Mortgage
$216,486
Outstanding Balance
$152,561
Interest Rate
3.51%
Mortgage Type
New Conventional
Estimated Equity
$653,676
Purchase Details
Closed on
Jun 12, 2012
Sold by
Reno Golden Hills Investors Llc
Bought by
Br Catron Llc
Purchase Details
Closed on
May 20, 2010
Sold by
Reynen & Bardis Communities Nevada Inc
Bought by
Reno Golden Hills Investors Llc
Create a Home Valuation Report for This Property
The Home Valuation Report is an in-depth analysis detailing your home's value as well as a comparison with similar homes in the area
Home Values in the Area
Average Home Value in this Area
Purchase History
| Date | Buyer | Sale Price | Title Company |
|---|---|---|---|
| Griswold John K | -- | None Available | |
| Griswold Joan K | $271,000 | First American Title Sparks | |
| Br Catron Llc | $1,026,000 | First American Title Sparks | |
| Reno Golden Hills Investors Llc | $2,000,000 | First Amer Title Paseo Verde |
Source: Public Records
Mortgage History
| Date | Status | Borrower | Loan Amount |
|---|---|---|---|
| Open | Griswold Joan K | $216,486 |
Source: Public Records
Tax History Compared to Growth
Tax History
| Year | Tax Paid | Tax Assessment Tax Assessment Total Assessment is a certain percentage of the fair market value that is determined by local assessors to be the total taxable value of land and additions on the property. | Land | Improvement |
|---|---|---|---|---|
| 2025 | $4,421 | $187,605 | $61,635 | $125,970 |
| 2024 | $4,295 | $180,554 | $53,935 | $126,619 |
| 2023 | $4,295 | $173,826 | $54,810 | $119,016 |
| 2022 | $4,170 | $146,842 | $48,160 | $98,683 |
| 2021 | $4,050 | $137,879 | $40,145 | $97,734 |
| 2020 | $3,930 | $134,990 | $37,415 | $97,575 |
| 2019 | $3,814 | $132,272 | $36,925 | $95,347 |
| 2018 | $3,668 | $117,495 | $26,040 | $91,455 |
| 2017 | $3,561 | $117,716 | $26,040 | $91,676 |
| 2016 | $3,471 | $116,027 | $24,430 | $91,597 |
| 2015 | $3,466 | $113,431 | $21,945 | $91,486 |
| 2014 | $3,159 | $93,480 | $17,500 | $75,980 |
| 2013 | -- | $83,645 | $15,190 | $68,455 |
Source: Public Records
Map
Nearby Homes
- 10380 Cavalry Cir
- 10150 Barrel Racer Dr
- 10300 Gold Mine Dr
- 10370 Palladium Mine Dr
- 10115 Barrel Racer Dr
- 10110 Cavalry Cir
- 2745 Trail Rider Dr
- 10135 Burghley Ct
- 2610 Trail Rider Dr
- 2860 Tobiano Dr
- 2780 Tobiano Dr
- 2830 Tobiano Dr
- 10595 Baton Ct
- 9895 Gainsborough Ln
- 9897 Firefoot Ln
- 2655 Fury Ct
- 10079 Cascade Falls Dr
- 9945 Amienda Way
- 10700 Summer Glen Dr
- 2590 Spring Flower Dr
- 10375 Cavalry Cir
- 10355 Cavalry Cir
- 2720 Gold Mine Ct
- 10394 Cavalry Cir
- 10390 Cavalry Cir
- 10345 Cavalry Cir
- 10190 Gold Mine Dr
- 10396 Cavalry Cir
- 10255 Cavalry Cir
- 10335 Cavalry Cir
- 10180 Gold Mine Dr
- 10398 Cavalry Cir
- 10235 Cavalry Cir
- 10265 Cavalry Cir
- 10370 Cavalry Cir
- 10275 Cavalry Cir
- 10360 Cavalry Cir
- 10225 Cavalry Cir
- 210 Noble Metal Ct
- 2695 Mule Cir