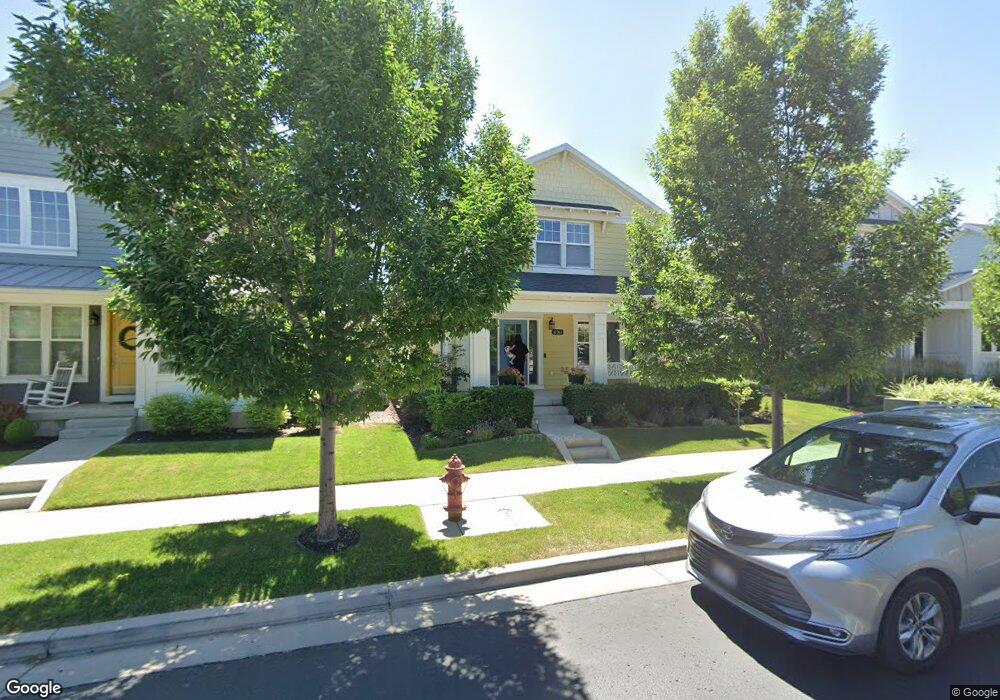
10367 S Otter Trail Dr South Jordan, UT 84009
Daybreak NeighborhoodEstimated Value: $649,099 - $661,000
3
Beds
1
Bath
3,295
Sq Ft
$199/Sq Ft
Est. Value
About This Home
This home is located at 10367 S Otter Trail Dr, South Jordan, UT 84009 and is currently estimated at $656,775, approximately $199 per square foot. 10367 S Otter Trail Dr is a home located in Salt Lake County with nearby schools including Golden Fields Elementary School, Mountain Creek Middle School, and Herriman High School.
Ownership History
Date
Name
Owned For
Owner Type
Purchase Details
Closed on
Sep 9, 2020
Sold by
Proctor Matthew K
Bought by
Jackson Gregory L and Fernelius Ikuko
Current Estimated Value
Home Financials for this Owner
Home Financials are based on the most recent Mortgage that was taken out on this home.
Original Mortgage
$414,000
Outstanding Balance
$367,398
Interest Rate
2.9%
Mortgage Type
New Conventional
Estimated Equity
$289,377
Purchase Details
Closed on
Dec 17, 2013
Sold by
Dbsf Llc
Bought by
Proctor Matthew K
Home Financials for this Owner
Home Financials are based on the most recent Mortgage that was taken out on this home.
Original Mortgage
$280,025
Interest Rate
4.04%
Mortgage Type
New Conventional
Purchase Details
Closed on
Jul 3, 2013
Sold by
Daybreak Development Co
Bought by
Holmes Homes Inc
Home Financials for this Owner
Home Financials are based on the most recent Mortgage that was taken out on this home.
Original Mortgage
$468,900
Interest Rate
3.88%
Mortgage Type
Construction
Create a Home Valuation Report for This Property
The Home Valuation Report is an in-depth analysis detailing your home's value as well as a comparison with similar homes in the area
Home Values in the Area
Average Home Value in this Area
Purchase History
| Date | Buyer | Sale Price | Title Company |
|---|---|---|---|
| Jackson Gregory L | -- | Investors Title Ins Agcy | |
| Proctor Matthew K | -- | Meridian Title | |
| Dbsf Llc | -- | Meridian Title | |
| Holmes Homes Inc | -- | First American Title |
Source: Public Records
Mortgage History
| Date | Status | Borrower | Loan Amount |
|---|---|---|---|
| Open | Jackson Gregory L | $414,000 | |
| Previous Owner | Proctor Matthew K | $280,025 | |
| Previous Owner | Holmes Homes Inc | $468,900 |
Source: Public Records
Tax History Compared to Growth
Tax History
| Year | Tax Paid | Tax Assessment Tax Assessment Total Assessment is a certain percentage of the fair market value that is determined by local assessors to be the total taxable value of land and additions on the property. | Land | Improvement |
|---|---|---|---|---|
| 2025 | $3,155 | $606,200 | $89,400 | $516,800 |
| 2024 | $3,155 | $599,100 | $86,800 | $512,300 |
| 2023 | $3,275 | $586,800 | $84,300 | $502,500 |
| 2022 | $3,378 | $593,100 | $82,600 | $510,500 |
| 2021 | $2,743 | $441,900 | $63,600 | $378,300 |
| 2020 | $2,510 | $379,000 | $60,000 | $319,000 |
| 2019 | $2,482 | $368,400 | $60,000 | $308,400 |
| 2018 | $2,361 | $348,700 | $59,800 | $288,900 |
| 2017 | $2,253 | $326,100 | $59,800 | $266,300 |
| 2016 | $2,400 | $329,200 | $59,800 | $269,400 |
| 2015 | $2,103 | $280,400 | $72,300 | $208,100 |
| 2014 | $2,071 | $271,400 | $85,100 | $186,300 |
Source: Public Records
Map
Nearby Homes
- 5023 S Jordan Pkwy W
- 10421 S Split Rock Dr
- 4881 S Jordan Pkwy W
- 4801 W South Jordan Pkwy
- 10617 S Split Rock Dr
- 4821 W Dock St
- 4966 W Kitsap Way Unit 10-532
- 4722 W Noyo Ln
- 10566 S Lake Ave
- 4712 W South Jordan Pkwy
- 4722 W Vermillion Dr
- 5239 W Bowstring Way Unit 518
- 10572 S Kestrel Rise Rd
- 10308 S Rubicon Rd
- 5261 W Bowstring Way
- 11381 S Watercourse Rd Unit 205
- 5248 W South Jordan Pkwy
- 5262 S Jordan Pkwy W
- 10117 S Glenmoor Dr
- 10606 S Redknife Dr
- 10371 S Otter Trail Dr
- 10357 S Otter Trail Dr
- 10379 S Otter Trail Dr
- 10349 S Otter Trail Dr
- 10373 S Otter Trail Dr
- 10361 S Otter Trail Dr Unit 353
- 10361 S Otter Trail Dr
- 10387 S Otter Trail Dr
- 5016 W Bowstring Way
- 10383 S Otter Trail Dr
- 10351 S Otter Trail Dr
- 10337 S Otter Trail Dr Unit 9-350
- 10382 S Otter Trail Dr Unit 9-343
- 10382 S Otter Trail Dr
- 10399 S Otter Trail Dr
- 10343 S Otter Trail Dr Unit 9-351
- 10343 S Otter Trail Dr
- 10391 S Otter Trail Dr
- 5017 W Burntside Ave
- 5026 W Bowstring Way