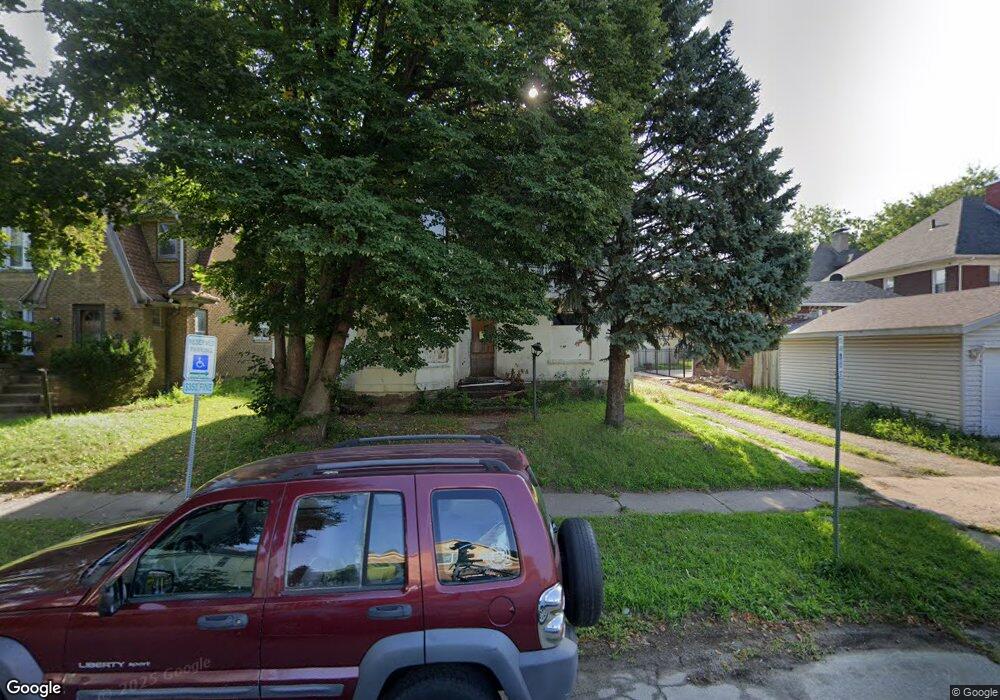
1037 16th St Rock Island, IL 61201
Longview NeighborhoodEstimated Value: $48,560 - $134,000
--
Bed
--
Bath
2,767
Sq Ft
$34/Sq Ft
Est. Value
About This Home
This home is located at 1037 16th St, Rock Island, IL 61201 and is currently estimated at $94,140, approximately $34 per square foot. 1037 16th St is a home located in Rock Island County with nearby schools including Rock Island Academy, Washington Junior High School, and Rock Island High School.
Ownership History
Date
Name
Owned For
Owner Type
Purchase Details
Closed on
Mar 9, 2022
Sold by
Theresa Babrah
Bought by
Qc Habitat
Current Estimated Value
Purchase Details
Closed on
Jan 4, 2022
Sold by
Qc Habitat
Bought by
Babrah Theresa
Purchase Details
Closed on
Jun 28, 2021
Sold by
Tremere Morney
Bought by
Qc Habitat
Purchase Details
Closed on
Dec 14, 2017
Sold by
Trust No 09 4756 1602202008
Bought by
Morney Tremere A and Bailey Dwight L
Purchase Details
Closed on
Nov 6, 2017
Sold by
County Of Rock Island
Bought by
Trust No 09 4756 1602202008
Create a Home Valuation Report for This Property
The Home Valuation Report is an in-depth analysis detailing your home's value as well as a comparison with similar homes in the area
Home Values in the Area
Average Home Value in this Area
Purchase History
| Date | Buyer | Sale Price | Title Company |
|---|---|---|---|
| Qc Habitat | -- | Rosenberg Jay J | |
| Babrah Theresa | -- | Rosenberg Jay J | |
| Qc Habitat | -- | Rosenburg Jay J | |
| Morney Tremere A | -- | Schrimpf Stephen P | |
| Trust No 09 4756 1602202008 | -- | Schrimpf Stephen P |
Source: Public Records
Tax History Compared to Growth
Tax History
| Year | Tax Paid | Tax Assessment Tax Assessment Total Assessment is a certain percentage of the fair market value that is determined by local assessors to be the total taxable value of land and additions on the property. | Land | Improvement |
|---|---|---|---|---|
| 2024 | $479 | $4,700 | $3,360 | $1,340 |
| 2023 | $479 | $4,485 | $3,206 | $1,279 |
| 2022 | $435 | $4,196 | $3,010 | $1,186 |
| 2021 | $431 | $4,027 | $2,889 | $1,138 |
| 2020 | $426 | $3,929 | $2,819 | $1,110 |
| 2019 | $425 | $3,929 | $2,819 | $1,110 |
| 2018 | $409 | $3,852 | $2,764 | $1,088 |
| 2017 | $382 | $0 | $0 | $0 |
| 2016 | $382 | $3,721 | $2,670 | $1,051 |
| 2015 | $366 | $3,527 | $2,531 | $996 |
| 2014 | $216 | $2,945 | $2,502 | $443 |
| 2013 | $216 | $2,945 | $2,502 | $443 |
Source: Public Records
Map
Nearby Homes
- 1008 16th St
- 1018 17th St Unit 1
- 903 17th St
- 1043 19th St
- 1900 13th Ave
- 1215-1215 1/2 20th St
- 1045 12th St Unit 1047
- 1234 12th St
- 1215 Glenhurst Ct
- 718 17th St
- 1212 Glenhurst Ct
- 1037 22nd St
- 1031 10th Ave
- 728 21st St
- 1030 23rd St
- 1621 14 1 2 St
- 1625 14 1 2 St
- 1635 20th St
- 1620 18th Ave Unit 26
- 1628 18th Ave Unit 10