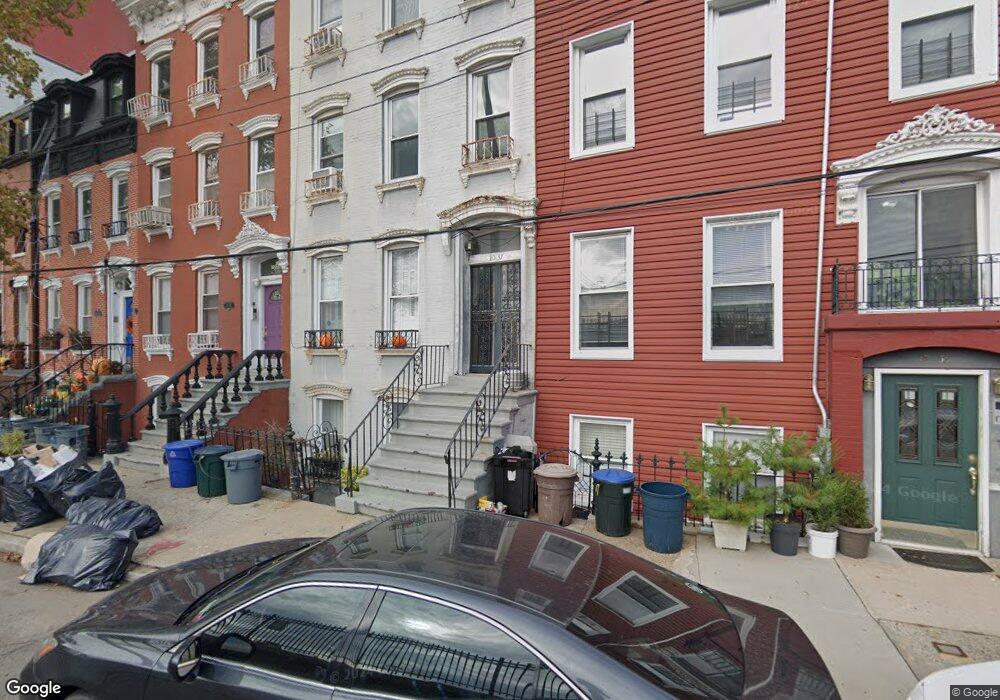
1037 51st Ave Long Island City, NY 11101
Hunters Point NeighborhoodEstimated Value: $2,085,000 - $2,805,000
--
Bed
--
Bath
2,820
Sq Ft
$867/Sq Ft
Est. Value
About This Home
This home is located at 1037 51st Ave, Long Island City, NY 11101 and is currently estimated at $2,445,000, approximately $867 per square foot. 1037 51st Ave is a home located in Queens County with nearby schools including P.S./I.S. 78Q Early Childhood Center, I.S. 204 Oliver W. Holmes, and Long Island City High School.
Ownership History
Date
Name
Owned For
Owner Type
Purchase Details
Closed on
Nov 13, 2017
Sold by
Incantalupo David
Bought by
Inca Realty Llc
Current Estimated Value
Purchase Details
Closed on
May 8, 2012
Sold by
Inca Realty Llc
Bought by
Incantalupo David
Home Financials for this Owner
Home Financials are based on the most recent Mortgage that was taken out on this home.
Original Mortgage
$612,500
Interest Rate
3.88%
Mortgage Type
New Conventional
Purchase Details
Closed on
Nov 1, 2000
Sold by
Squillace Michael
Bought by
Inca Realty Llc
Home Financials for this Owner
Home Financials are based on the most recent Mortgage that was taken out on this home.
Original Mortgage
$300,000
Interest Rate
7.76%
Mortgage Type
Seller Take Back
Create a Home Valuation Report for This Property
The Home Valuation Report is an in-depth analysis detailing your home's value as well as a comparison with similar homes in the area
Home Values in the Area
Average Home Value in this Area
Purchase History
| Date | Buyer | Sale Price | Title Company |
|---|---|---|---|
| Inca Realty Llc | -- | -- | |
| Incantalupo David | -- | -- | |
| Inca Realty Llc | $400,000 | First American Title Ins Co |
Source: Public Records
Mortgage History
| Date | Status | Borrower | Loan Amount |
|---|---|---|---|
| Previous Owner | Incantalupo David | $612,500 | |
| Previous Owner | Inca Realty Llc | $300,000 |
Source: Public Records
Tax History Compared to Growth
Tax History
| Year | Tax Paid | Tax Assessment Tax Assessment Total Assessment is a certain percentage of the fair market value that is determined by local assessors to be the total taxable value of land and additions on the property. | Land | Improvement |
|---|---|---|---|---|
| 2025 | $8,808 | $46,470 | $6,660 | $39,810 |
| 2024 | $8,808 | $43,856 | $5,903 | $37,953 |
| 2023 | $8,729 | $43,462 | $6,037 | $37,425 |
| 2022 | $8,190 | $129,900 | $21,660 | $108,240 |
| 2021 | $8,151 | $109,140 | $21,660 | $87,480 |
| 2020 | $8,197 | $102,000 | $21,660 | $80,340 |
| 2019 | $7,645 | $87,660 | $21,660 | $66,000 |
| 2018 | $7,383 | $36,218 | $8,365 | $27,853 |
| 2017 | $6,969 | $34,188 | $10,676 | $23,512 |
| 2016 | $6,452 | $34,188 | $10,676 | $23,512 |
| 2015 | $2,593 | $32,271 | $12,378 | $19,893 |
| 2014 | $2,593 | $30,456 | $11,682 | $18,774 |
Source: Public Records
Map
Nearby Homes
- 10-64 Jackson Ave Unit 4-B
- 11-02 49th Ave Unit 8-A
- 11-02 49th Ave Unit 9-E
- 206B Plan at Vesta
- 407B Plan at Vesta
- PH4A Plan at Vesta
- 405B Plan at Vesta
- 608B Plan at Vesta
- 207A Plan at Vesta
- 210B Plan at Vesta
- 311B Plan at Vesta
- 502A Plan at Vesta
- 204A Plan at Vesta
- 305B Plan at Vesta
- 301A Plan at Vesta
- 510B Plan at Vesta
- 404B Plan at Vesta
- 405A Plan at Vesta
- 309B Plan at Vesta
- 5-27 51st Ave Unit PH-B
- 1035 51st Ave
- 1033 51st Ave
- 10-31 51st Ave Unit 3
- 10-31 51st Ave Unit 2
- 10 -31 51st Ave Unit 3
- 1031 51st Ave
- 1039 51st Ave
- 10-39 51st Ave Unit B
- 10-39 51st Ave Unit C
- 10-39 51st Ave Unit A
- 10-39 51st Ave Unit 3
- 10-41 51st Ave
- 10-41 51st Ave Unit 2
- 10-41 51st Ave Unit 1
- 1041 51st Ave Unit 3
- 1041 51st Ave Unit 3 FL
- 1041 51st Ave Unit 2 FL
- 1041 51st Ave
- 1041 51st Ave Unit 1
- 1041 51st Ave Unit 1+2