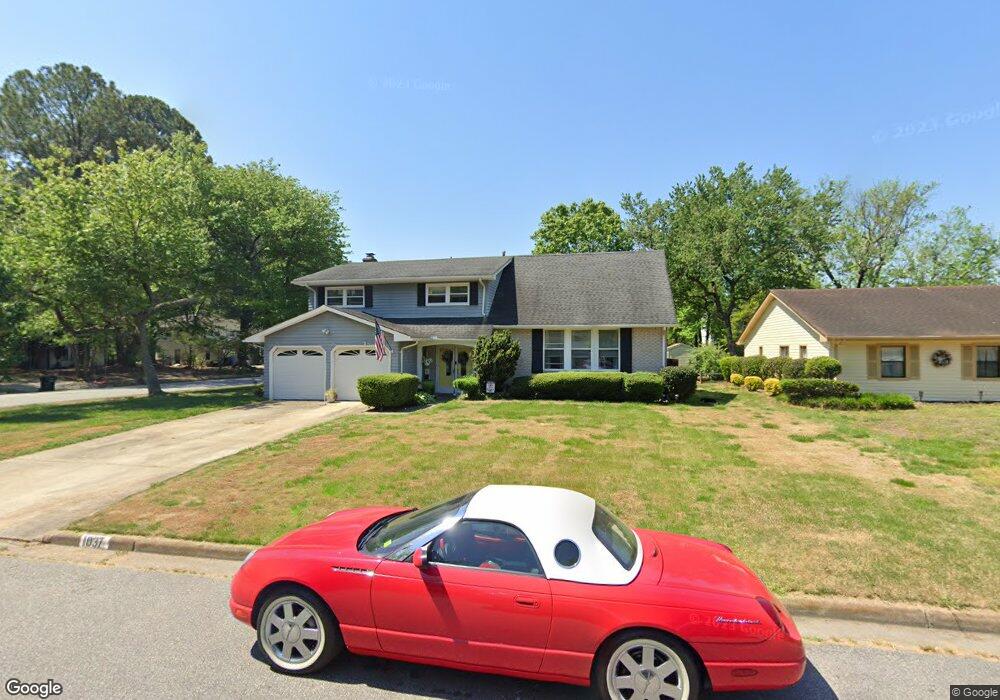
1037 Anderson Way Virginia Beach, VA 23464
Estimated Value: $420,000 - $467,000
4
Beds
3
Baths
2,420
Sq Ft
$182/Sq Ft
Est. Value
About This Home
This home is located at 1037 Anderson Way, Virginia Beach, VA 23464 and is currently estimated at $440,374, approximately $181 per square foot. 1037 Anderson Way is a home located in Virginia Beach City with nearby schools including College Park Elementary School, Brandon Middle School, and Tallwood High School.
Ownership History
Date
Name
Owned For
Owner Type
Purchase Details
Closed on
May 8, 2024
Sold by
Arehart Sabrina
Bought by
Twigg Jonathan Edmond and Hamilton Ashley Danielle
Current Estimated Value
Home Financials for this Owner
Home Financials are based on the most recent Mortgage that was taken out on this home.
Original Mortgage
$436,959
Outstanding Balance
$430,762
Interest Rate
6.82%
Mortgage Type
VA
Estimated Equity
$9,612
Purchase Details
Closed on
Apr 8, 2015
Sold by
Nationstar Mortgage Llc
Bought by
Arehart Sabrina
Home Financials for this Owner
Home Financials are based on the most recent Mortgage that was taken out on this home.
Original Mortgage
$181,212
Interest Rate
3.77%
Mortgage Type
VA
Purchase Details
Closed on
Dec 10, 2014
Sold by
Ferguson Sub Tr William
Bought by
Nationstar Mortgage Llc
Create a Home Valuation Report for This Property
The Home Valuation Report is an in-depth analysis detailing your home's value as well as a comparison with similar homes in the area
Home Values in the Area
Average Home Value in this Area
Purchase History
| Date | Buyer | Sale Price | Title Company |
|---|---|---|---|
| Twigg Jonathan Edmond | $423,000 | Fidelity National Title | |
| Arehart Sabrina | $186,000 | -- | |
| Nationstar Mortgage Llc | $180,240 | -- |
Source: Public Records
Mortgage History
| Date | Status | Borrower | Loan Amount |
|---|---|---|---|
| Open | Twigg Jonathan Edmond | $436,959 | |
| Previous Owner | Arehart Sabrina | $181,212 |
Source: Public Records
Tax History Compared to Growth
Tax History
| Year | Tax Paid | Tax Assessment Tax Assessment Total Assessment is a certain percentage of the fair market value that is determined by local assessors to be the total taxable value of land and additions on the property. | Land | Improvement |
|---|---|---|---|---|
| 2025 | $3,228 | $389,900 | $130,000 | $259,900 |
| 2024 | $3,228 | $332,800 | $130,000 | $202,800 |
| 2023 | $3,064 | $309,500 | $115,000 | $194,500 |
| 2022 | $2,816 | $284,400 | $105,000 | $179,400 |
| 2021 | $2,512 | $253,700 | $81,000 | $172,700 |
| 2020 | $2,569 | $252,500 | $81,000 | $171,500 |
| 2019 | $2,447 | $232,200 | $81,000 | $151,200 |
| 2018 | $2,328 | $232,200 | $81,000 | $151,200 |
| 2017 | $2,285 | $227,900 | $81,000 | $146,900 |
| 2016 | $2,231 | $225,400 | $81,000 | $144,400 |
| 2015 | $2,167 | $218,900 | $80,400 | $138,500 |
| 2014 | $2,115 | $217,800 | $91,200 | $126,600 |
Source: Public Records
Map
Nearby Homes
- 1052 Lockwood Ct
- 1213 Clydesdale Ln
- 1066 Commonwealth Place
- 1031 Bryce Ln
- 1027 Bryce Ln
- 1001 Commonwealth Place
- 1240 Clydesdale Ln
- 5966 Edgelake Dr
- 6344 Bucknell Cir
- 6415 Duquesne Place
- 6464 Duquesne Place
- 1241 Glyndon Dr
- 1183 Meadow Sage Ln
- 808 Raymond Ct
- 2006 Sparrow Rd
- 2023 Sparrow Rd
- 2100 Lockard Ave
- 5872 Connors Dr
- 729 Howell St
- 5809 Beechwalk Dr
- 1033 Anderson Way
- 1016 Bates Way
- 1036 Anderson Way
- 1029 Anderson Way
- 6217 Auburn Dr
- 1012 Bates Way
- 6213 Auburn Dr
- 1032 Anderson Way
- 6209 Auburn Dr
- 6221 Auburn Dr
- 1028 Anderson Way
- 1008 Bates Way
- 1025 Anderson Way
- 6205 Auburn Dr
- 6225 Auburn Dr
- 1017 Amherst Ln
- 1013 Bates Way
- 1024 Anderson Way
- 6112 Plateau Ct
- 1013 Amherst Ln