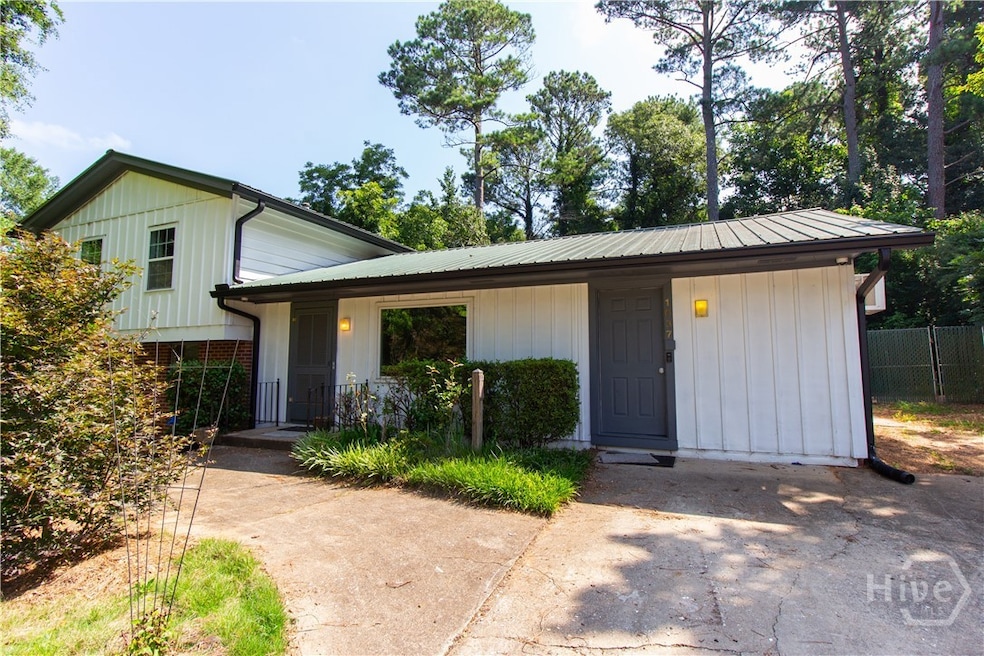


1037 College Station Rd Athens, GA 30605
Highlights
- Colonial Architecture
- No HOA
- Fenced Yard
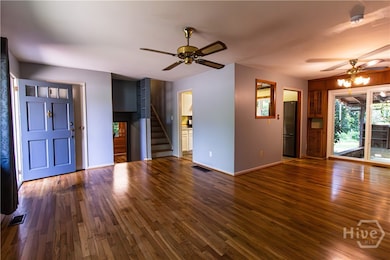
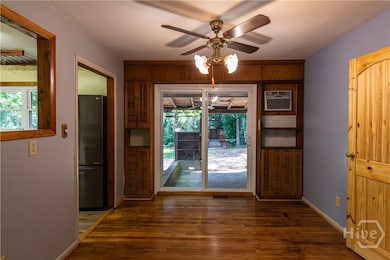
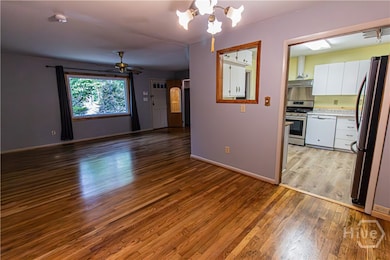
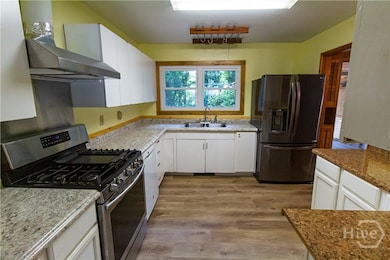
- Wood Flooring
- Covered Patio or Porch
- Cooling System Mounted In Outer Wall Opening
About This Home
This impressive 5-bedroom, 3-bath home is AVAILABLE APRIL 2026. New light fixtures, New kitchen, New appliances, New bathrooms! 2 bedrooms have a private entrance/exit and bathroom, which would be great as a mother-in-law suite or for busy college students. The private backyard is fully fenced and includes a swing and multiple covered patios to beat the heat and enjoy UGA Game Days outside with friends. The backyard includes 3 storage buildings for all your tools or crafts. Schedule a tour today so you can watch the flowers bloom in the backyard next spring :) Ample parking available. Located on "UGA's Campus & Vet Tech Hospital Bus Route" and "Athens Bus Route 26, College Station." Close to UGA, schools, shopping, and professional areas. Clothes washer, dryer, fridge, oven, gas range, natural gas backup power generator, private video security system, auxiliary speaker system, and safe included!
Co-Listing Agent
Rich Orban
Red 1 Realty License #327060
Home Details
Home Type
- Single Family
Est. Annual Taxes
- $4,182
Year Built
- Built in 1975
Lot Details
- 0.31 Acre Lot
- Fenced Yard
- Wood Fence
- Chain Link Fence
- Property is zoned RS-15
Home Design
- Colonial Architecture
- Brick Exterior Construction
- Vinyl Siding
Interior Spaces
- 2,170 Sq Ft Home
- 2-Story Property
- Wired For Sound
- Basement
- Laundry in Basement
Kitchen
- Oven
- Range
- Dishwasher
Flooring
- Wood
- Carpet
- Tile
Bedrooms and Bathrooms
- 5 Bedrooms
- 3 Full Bathrooms
Laundry
- Dryer
- Washer
Home Security
- Home Security System
- Security Lights
Outdoor Features
- Covered Patio or Porch
- Play Equipment
Schools
- Barnett Shoals Elementary School
- Hilsman Middle School
- Cedar Shoals High School
Utilities
- Cooling System Mounted In Outer Wall Opening
- Central Air
- Heating System Uses Gas
- Heat Pump System
- Gas Water Heater
- Cable TV Available
Listing and Financial Details
- Security Deposit $2,500
- Tenant pays for cable TV, electricity, gas, sewer, trash collection, telephone, water
- Tax Lot 4
- Assessor Parcel Number 182B3-D-026
Community Details
Overview
- No Home Owners Association
- Secondary HOA Phone (706) 612-7863
- University Heights Sec 02 Subdivision
Pet Policy
- Pets Allowed
- Pet Deposit $300
Map
Source: CLASSIC MLS (Athens Area Association of REALTORS®)
MLS Number: CL344606
APN: 182B3-D-026
Disclaimer: Certain information contained herein is derived from information provided by parties other than Homes.com. All information provided is deemed reliable, but is not guaranteed to be accurate and should be independently verified.
![]() IDX information is provided exclusively for personal, non-commercial use, and may not be used for any purpose other than to identify prospective properties consumers may be interested in purchasing. Information is deemed reliable but not guaranteed.
IDX information is provided exclusively for personal, non-commercial use, and may not be used for any purpose other than to identify prospective properties consumers may be interested in purchasing. Information is deemed reliable but not guaranteed.
- 1029 College Station Rd
- 1067 College Station Rd
- 105 Segrest Cir
- 411 College Cir
- 325 Segrest Cir
- 310 Research Dr Unit 802
- 310 Research Dr Unit 602
- 152 Spalding Ct
- 335 Caldwell Cir
- 310 Spalding Cir
- 119 Pine Ridge Trace
- 1138 Barnett Shoals Rd
- 1120 Barnett Shoals Rd
- 171 Birch Valley Dr
- 170 Brookwood Dr
- 1035 Barnett Shoals Rd Unit 1227
- 1035 Barnett Shoals Rd Unit 913
- 1000 College Station Rd
- 1005 College Station Rd
- 270 Segrest Cir
- 175 International Dr
- 110 International Dr
- 255 Research Dr
- 192 Cedar Rock Trace
- 360 Piccadilly Square
- 1580 Barnett Shoals Rd
- 425 Riverbend Pkwy
- 1035 Barnett Shoals Rd
- 355 Riverbend Pkwy
- 1035 Barnett Shoals Rd Unit 1012
- 100 Still Creek Ln
- 90 Woodsong Ave Unit 3br and 4br Floorplans
- 135 Oconee River Cir
- 490 Barnett Shoals Rd Unit 531
- 187 Woodstone Dr
- 147 Park Ridge Ct
- 660 Barnett Shoals Rd Unit 223
