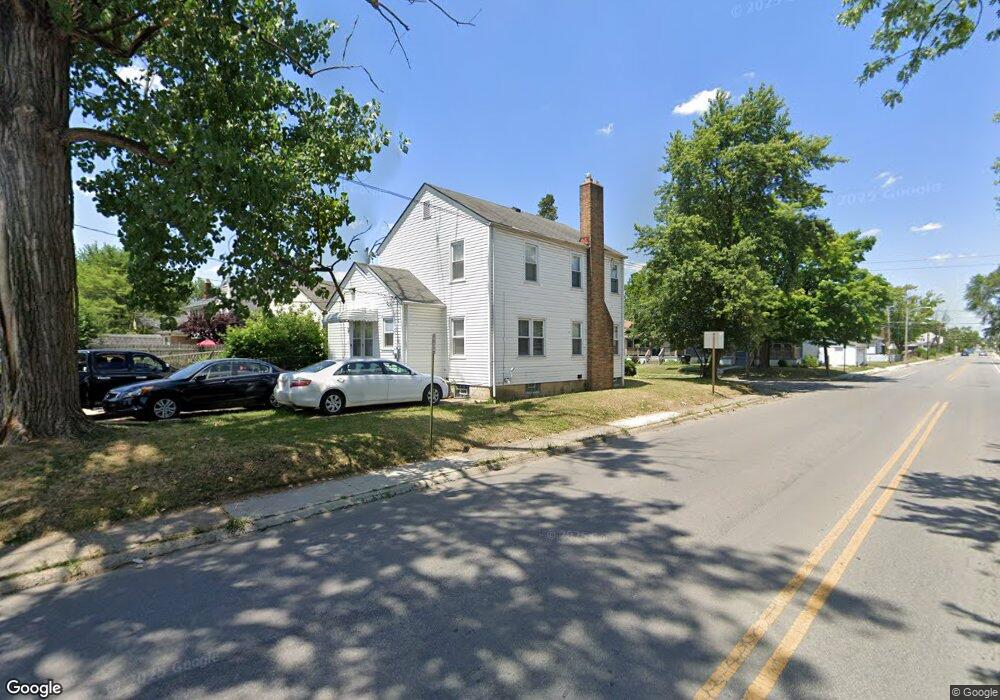
1037 E 18th Ave Columbus, OH 43211
South Linden NeighborhoodEstimated Value: $127,000 - $169,000
3
Beds
1
Bath
1,000
Sq Ft
$152/Sq Ft
Est. Value
About This Home
This home is located at 1037 E 18th Ave, Columbus, OH 43211 and is currently estimated at $151,879, approximately $151 per square foot. 1037 E 18th Ave is a home located in Franklin County with nearby schools including Linden-Mckinley Stem School On Arcadia, North Columbus Preparatory Academy, and AchievePoint Career Academy - Columbus.
Ownership History
Date
Name
Owned For
Owner Type
Purchase Details
Closed on
Oct 29, 2021
Sold by
Clark David and Clark Dmitri
Bought by
Apex Investments 4 Llc
Current Estimated Value
Home Financials for this Owner
Home Financials are based on the most recent Mortgage that was taken out on this home.
Original Mortgage
$78,500
Interest Rate
2.37%
Purchase Details
Closed on
Sep 2, 2021
Sold by
Clark Darrell
Bought by
Clark Danny and Clark David
Home Financials for this Owner
Home Financials are based on the most recent Mortgage that was taken out on this home.
Original Mortgage
$78,500
Interest Rate
2.37%
Purchase Details
Closed on
Mar 31, 2018
Sold by
Clark Arlena
Bought by
Clark Danny and Clark David
Purchase Details
Closed on
May 8, 2012
Sold by
Clark David
Bought by
Clark Arlena
Purchase Details
Closed on
Jan 21, 1966
Bought by
Clark David and Clark Arlena
Create a Home Valuation Report for This Property
The Home Valuation Report is an in-depth analysis detailing your home's value as well as a comparison with similar homes in the area
Home Values in the Area
Average Home Value in this Area
Purchase History
| Date | Buyer | Sale Price | Title Company |
|---|---|---|---|
| Apex Investments 4 Llc | $85,000 | Axxis Title Agency Ltd | |
| Clark Danny | $51,400 | Axxis Title Agency Ltd | |
| Clark Danny | -- | None Available | |
| Clark Arlena | -- | None Available | |
| Clark David | -- | -- |
Source: Public Records
Mortgage History
| Date | Status | Borrower | Loan Amount |
|---|---|---|---|
| Closed | Apex Investments 4 Llc | $78,500 |
Source: Public Records
Tax History
| Year | Tax Paid | Tax Assessment Tax Assessment Total Assessment is a certain percentage of the fair market value that is determined by local assessors to be the total taxable value of land and additions on the property. | Land | Improvement |
|---|---|---|---|---|
| 2025 | $2,460 | $50,410 | $4,730 | $45,680 |
| 2024 | $2,460 | $50,410 | $4,730 | $45,680 |
| 2023 | $2,471 | $50,410 | $4,730 | $45,680 |
| 2022 | $1,631 | $18,000 | $2,280 | $15,720 |
| 2021 | $481 | $18,000 | $2,280 | $15,720 |
| 2020 | $481 | $18,000 | $2,280 | $15,720 |
| 2019 | $875 | $14,420 | $1,890 | $12,530 |
| 2018 | $325 | $14,420 | $1,890 | $12,530 |
| 2017 | $344 | $14,420 | $1,890 | $12,530 |
| 2016 | $339 | $13,860 | $2,730 | $11,130 |
| 2015 | $307 | $13,860 | $2,730 | $11,130 |
| 2014 | $308 | $13,860 | $2,730 | $11,130 |
| 2013 | $198 | $15,400 | $3,045 | $12,355 |
Source: Public Records
Map
Nearby Homes
- 957 E 17th Ave
- 1705 Lexington Ave
- 1045-1051 E 20th Ave
- 1129 E 17th Ave
- 914-916 E 17th Ave
- 1047 E 21st Ave
- 1673 Cleveland Ave
- 0 E 18th Ave
- 1136 E 21st Ave
- 1027 E 14th Ave
- 990 E 21st Ave
- 1033 E 22nd Ave
- 1129 E 23rd Ave Unit 1129 - 1131
- 1111 Windsor Ave
- 1121 Windsor Ave
- 1218 E 22nd Ave
- 915 E 13th Ave
- 1538-1542 Accommodation Ave
- 957 E 12th Ave
- 1249-1251 E 15th Ave
- 1033 E 18th Ave
- 1029 E 18th Ave
- 1049 E 18th Ave
- 1023 E 18th Ave
- 1053 E 18th Ave
- 1019 E 18th Ave
- 1057 E 18th Ave Unit 59
- 1032 E 17th Ave
- 1057-1059 E 18th Ave
- 1026 E 17th Ave
- 1022 E 17th Ave
- 1015 E 18th Ave
- 1042 E 17th Ave
- 1061 E 18th Ave Unit 63
- 1061-1063 E 18th Ave
- 1040 E 18th Ave
- 1036 E 18th Ave
- 1046 E 17th Ave
- 1030 E 18th Ave
Your Personal Tour Guide
Ask me questions while you tour the home.