1037 Fairfield Beach Rd Unit June-August Fairfield, CT 06824
Fairfield Beach NeighborhoodEstimated Value: $2,140,154 - $2,684,000
4
Beds
4
Baths
2,349
Sq Ft
$1,034/Sq Ft
Est. Value
About This Home
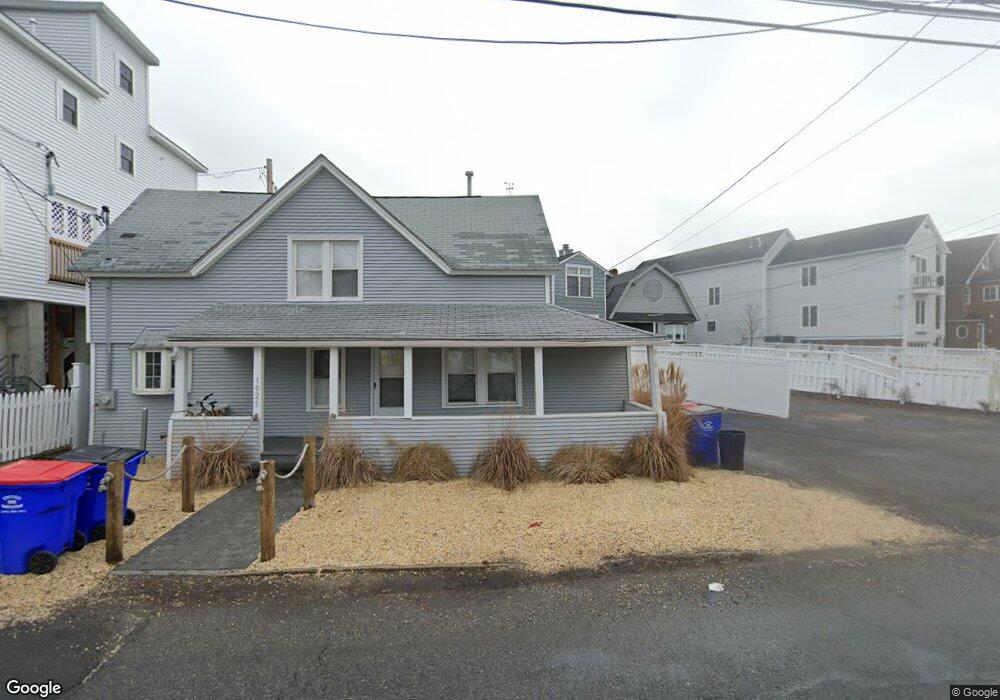
This home is located at 1037 Fairfield Beach Rd Unit June-August, Fairfield, CT 06824 and is currently estimated at $2,429,539, approximately $1,034 per square foot. 1037 Fairfield Beach Rd Unit June-August is a home located in Fairfield County with nearby schools including Roger Sherman Elementary School, Roger Ludlowe Middle School, and Fairfield Ludlowe High School.
Ownership History
Date
Name
Owned For
Owner Type
Purchase Details
Closed on
Oct 23, 2025
Sold by
Jlt Properties Llc
Bought by
Ciambriello Gaetano
Current Estimated Value
Home Financials for this Owner
Home Financials are based on the most recent Mortgage that was taken out on this home.
Original Mortgage
$1,256,500
Outstanding Balance
$1,256,500
Interest Rate
6.35%
Mortgage Type
Purchase Money Mortgage
Estimated Equity
$1,173,039
Purchase Details
Closed on
Jun 29, 2021
Sold by
Feldman Stephanie and Feldman Todd
Bought by
Jlt Properties Llc
Purchase Details
Closed on
Sep 14, 2017
Sold by
Dandrea Susan
Bought by
Feldman Todd and Feldman Stephanie
Home Financials for this Owner
Home Financials are based on the most recent Mortgage that was taken out on this home.
Original Mortgage
$960,000
Interest Rate
3.93%
Mortgage Type
Purchase Money Mortgage
Purchase Details
Closed on
Mar 18, 2013
Sold by
Julich Donald
Bought by
Julich Donald
Create a Home Valuation Report for This Property
The Home Valuation Report is an in-depth analysis detailing your home's value as well as a comparison with similar homes in the area
Home Values in the Area
Average Home Value in this Area
Purchase History
| Date | Buyer | Sale Price | Title Company |
|---|---|---|---|
| Ciambriello Gaetano | $1,795,000 | -- | |
| Jlt Properties Llc | $1,500,000 | None Available | |
| Jlt Properties Llc | $1,500,000 | None Available | |
| Feldman Todd | $1,200,000 | -- | |
| Feldman Todd | $1,200,000 | -- | |
| Julich Donald | -- | -- | |
| Julich Donald | -- | -- |
Source: Public Records
Mortgage History
| Date | Status | Borrower | Loan Amount |
|---|---|---|---|
| Open | Ciambriello Gaetano | $1,256,500 | |
| Previous Owner | Julich Donald | $960,000 |
Source: Public Records
Tax History Compared to Growth
Tax History
| Year | Tax Paid | Tax Assessment Tax Assessment Total Assessment is a certain percentage of the fair market value that is determined by local assessors to be the total taxable value of land and additions on the property. | Land | Improvement |
|---|---|---|---|---|
| 2025 | $30,292 | $1,067,010 | $823,620 | $243,390 |
| 2024 | $29,770 | $1,067,010 | $823,620 | $243,390 |
| 2023 | $29,353 | $1,067,010 | $823,620 | $243,390 |
| 2022 | $29,065 | $1,067,010 | $823,620 | $243,390 |
| 2021 | $31,838 | $1,180,060 | $823,620 | $356,440 |
| 2020 | $26,672 | $995,610 | $765,520 | $230,090 |
| 2019 | $26,672 | $995,610 | $765,520 | $230,090 |
| 2018 | $25,429 | $964,670 | $765,520 | $199,150 |
| 2017 | $24,908 | $964,670 | $765,520 | $199,150 |
| 2016 | $24,551 | $964,670 | $765,520 | $199,150 |
| 2015 | $30,236 | $1,219,680 | $1,058,400 | $161,280 |
| 2014 | $29,760 | $1,219,680 | $1,058,400 | $161,280 |
Source: Public Records
Map
Nearby Homes
- 1008 Fairfield Beach Rd
- 1235 Fairfield Beach Rd
- 6 Lighthouse Point
- 783 Reef Rd
- 465 Edward St
- 748 Rowland Rd
- 35 Millard St
- 137 Millard St
- 2 Mellow St
- 394 Penfield Rd
- 260 Birch Rd
- 196 Catherine Terrace
- 378 Penfield Rd
- 345 Reef Rd Unit B6
- 345 Reef Rd Unit C9
- 294 Catherine Terrace
- 127 Paul Place
- 97 Field Point Dr
- 2117 Fairfield Beach Rd
- 2142 Fairfield Beach Rd
- 1037 Fairfield Beach Rd
- 1045 Fairfield Beach Rd
- 1027 Fairfield Beach Rd
- 1025 Fairfield Beach Rd
- 1053 Fairfield Beach Rd
- 1034 Fairfield Beach Rd
- 1019 Fairfield Beach Rd
- 1057 Fairfield Beach Rd
- 1054 Fairfield Beach Rd
- 1015 Fairfield Beach Rd
- 1024 Fairfield Beach Rd
- 1011 Fairfield Beach Rd
- 1073 Fairfield Beach Rd
- 1080 Fairfield Beach Rd
- 1021 Fairfield Beach Rd
- 1001 Fairfield Beach Rd
- 953 Fairfield Beach Rd
- 1091 Fairfield Beach Rd
- 1016 Fairfield Beach Rd
- 998 Fairfield Beach Rd