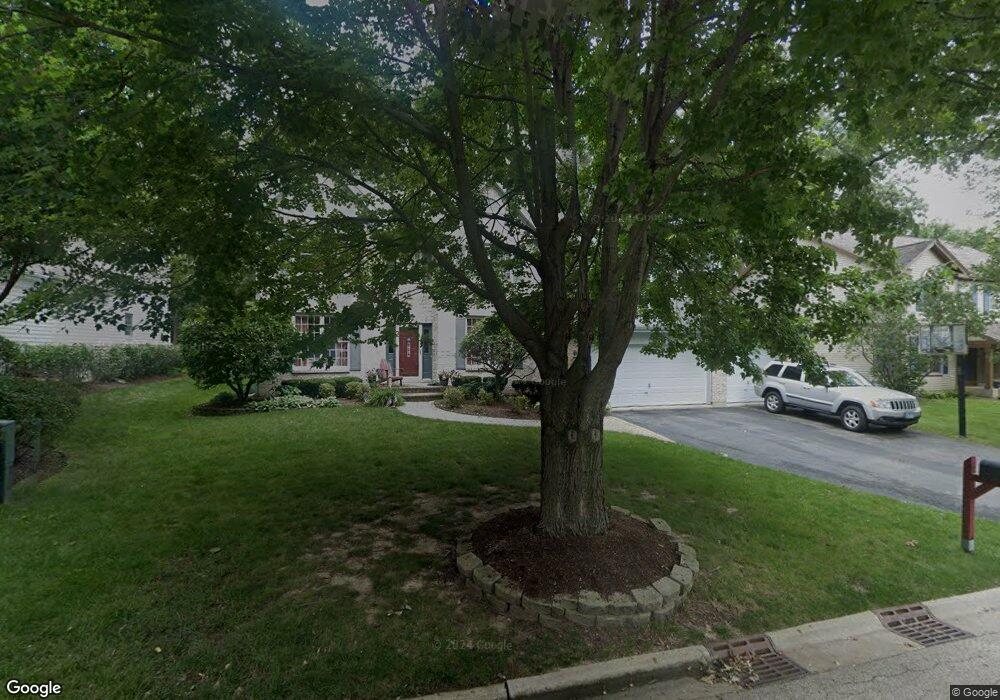
1037 Potomac Ct Grayslake, IL 60030
Estimated Value: $579,680 - $665,000
6
Beds
3
Baths
3,315
Sq Ft
$188/Sq Ft
Est. Value
About This Home
This home is located at 1037 Potomac Ct, Grayslake, IL 60030 and is currently estimated at $623,420, approximately $188 per square foot. 1037 Potomac Ct is a home located in Lake County with nearby schools including Meadowview School, Frederick School, and Grayslake Middle School.
Ownership History
Date
Name
Owned For
Owner Type
Purchase Details
Closed on
Sep 22, 2000
Sold by
Dreamer Steven L and Dreamer Kim A
Bought by
Peterson Vince A and Peterson Ann Marie
Current Estimated Value
Home Financials for this Owner
Home Financials are based on the most recent Mortgage that was taken out on this home.
Original Mortgage
$280,000
Interest Rate
7.87%
Purchase Details
Closed on
Jan 20, 1999
Sold by
Bishop Scott A and Bishop Jan M
Bought by
Dreamer Steven L and Dreamer Kim A
Home Financials for this Owner
Home Financials are based on the most recent Mortgage that was taken out on this home.
Original Mortgage
$268,000
Interest Rate
7%
Purchase Details
Closed on
Jun 15, 1998
Sold by
Oak Brook Bank
Bought by
Bishop Scott A
Home Financials for this Owner
Home Financials are based on the most recent Mortgage that was taken out on this home.
Original Mortgage
$227,000
Interest Rate
5.75%
Create a Home Valuation Report for This Property
The Home Valuation Report is an in-depth analysis detailing your home's value as well as a comparison with similar homes in the area
Home Values in the Area
Average Home Value in this Area
Purchase History
| Date | Buyer | Sale Price | Title Company |
|---|---|---|---|
| Peterson Vince A | $350,000 | -- | |
| Dreamer Steven L | $335,000 | -- | |
| Bishop Scott A | $323,500 | 1St American Title |
Source: Public Records
Mortgage History
| Date | Status | Borrower | Loan Amount |
|---|---|---|---|
| Previous Owner | Peterson Vince A | $280,000 | |
| Previous Owner | Dreamer Steven L | $268,000 | |
| Previous Owner | Bishop Scott A | $227,000 |
Source: Public Records
Tax History Compared to Growth
Tax History
| Year | Tax Paid | Tax Assessment Tax Assessment Total Assessment is a certain percentage of the fair market value that is determined by local assessors to be the total taxable value of land and additions on the property. | Land | Improvement |
|---|---|---|---|---|
| 2024 | $14,708 | $161,398 | $20,189 | $141,209 |
| 2023 | $15,220 | $141,073 | $17,647 | $123,426 |
| 2022 | $15,220 | $137,925 | $14,881 | $123,044 |
| 2021 | $15,031 | $132,569 | $14,303 | $118,266 |
| 2020 | $15,012 | $126,136 | $13,609 | $112,527 |
| 2019 | $15,134 | $121,017 | $13,057 | $107,960 |
| 2018 | $14,772 | $118,937 | $19,264 | $99,673 |
| 2017 | $14,702 | $111,878 | $18,121 | $93,757 |
| 2016 | $14,138 | $103,276 | $16,728 | $86,548 |
| 2015 | $13,811 | $94,350 | $15,282 | $79,068 |
| 2014 | $12,051 | $82,808 | $16,027 | $66,781 |
| 2012 | $11,837 | $86,483 | $16,738 | $69,745 |
Source: Public Records
Map
Nearby Homes
- 1050 Williamsburg Cir
- 21238 W Washington St
- 65 Pimlico Ct
- 34625 N Il Route 83
- 872 Tylerton Cir
- 1409 Doolittle Ln
- 1333 Belle Haven Dr
- 1501 Belle Haven Dr
- 223 Litchfield Ct
- 263 Arlington Ln
- 219 Galway St
- 268 Normandy Ln
- 1270 Chesterfield Ln
- 381 Gatewood Ln
- 396 Fairfax Ln
- 20295 W Washington St
- 739 Alleghany Rd
- 34386 N Lakeside Dr
- 479 Gatewood Ln
- 418 Flanders Ln
- 1025 Potomac Ct
- 1049 Potomac Ct
- 1061 Potomac Ct
- 1013 Potomac Ct
- 1040 Potomac Ct
- 1046 Williamsburg Cir
- 1028 Potomac Ct
- 1058 Potomac Ct
- 1073 Potomac Ct
- 1001 Potomac Ct
- 1038 Williamsburg Cir
- 1054 Williamsburg Cir
- 1016 Potomac Ct
- 1074 Potomac Ct
- 1004 Potomac Ct
- 1085 Potomac Ct
- 976 Tylerton Cir
- 1082 Potomac Ct
- 980 Tylerton Cir
- 85 Jamestown Ct