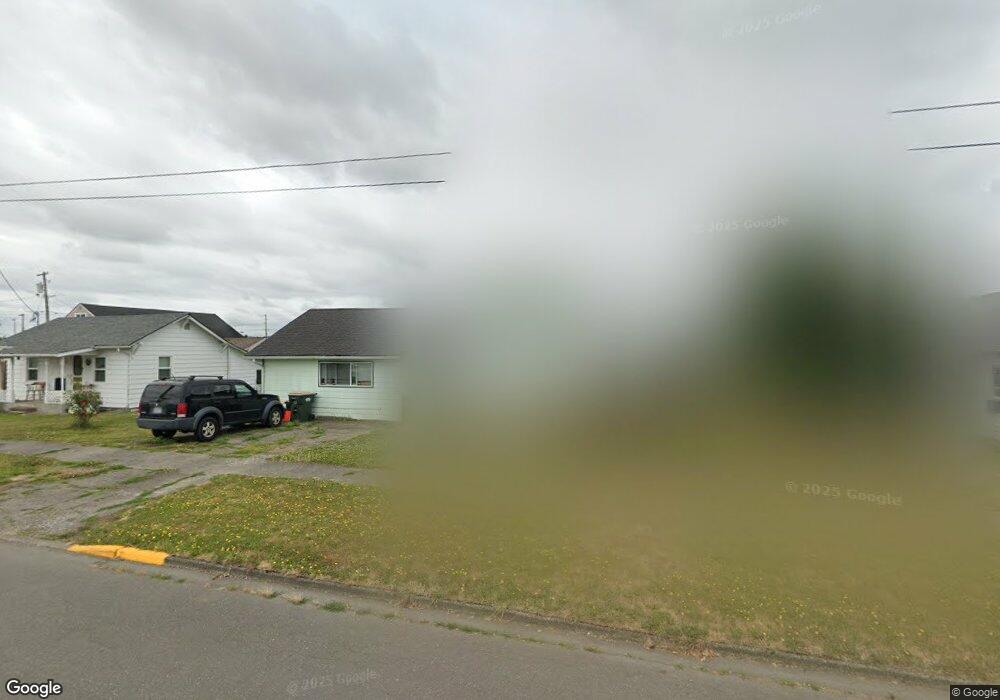
1037 SW Cascade Ave Chehalis, WA 98532
Estimated Value: $281,000 - $320,000
3
Beds
1
Bath
1,400
Sq Ft
$215/Sq Ft
Est. Value
About This Home
This home is located at 1037 SW Cascade Ave, Chehalis, WA 98532 and is currently estimated at $300,495, approximately $214 per square foot. 1037 SW Cascade Ave is a home located in Lewis County with nearby schools including James W. Lintott Elementary School, R E Bennett Elementary School, and Olympic Elementary School.
Ownership History
Date
Name
Owned For
Owner Type
Purchase Details
Closed on
Oct 30, 2025
Sold by
Wiseman Robert and Wiseman Carla
Bought by
Summa Real Estate Llc
Current Estimated Value
Home Financials for this Owner
Home Financials are based on the most recent Mortgage that was taken out on this home.
Original Mortgage
$300,000
Outstanding Balance
$300,000
Interest Rate
6.26%
Mortgage Type
Seller Take Back
Estimated Equity
$495
Create a Home Valuation Report for This Property
The Home Valuation Report is an in-depth analysis detailing your home's value as well as a comparison with similar homes in the area
Home Values in the Area
Average Home Value in this Area
Purchase History
| Date | Buyer | Sale Price | Title Company |
|---|---|---|---|
| Summa Real Estate Llc | $300,000 | Title Guaranty |
Source: Public Records
Mortgage History
| Date | Status | Borrower | Loan Amount |
|---|---|---|---|
| Open | Summa Real Estate Llc | $300,000 |
Source: Public Records
Tax History
| Year | Tax Paid | Tax Assessment Tax Assessment Total Assessment is a certain percentage of the fair market value that is determined by local assessors to be the total taxable value of land and additions on the property. | Land | Improvement |
|---|---|---|---|---|
| 2025 | $1,960 | $247,600 | $95,800 | $151,800 |
| 2024 | $1,960 | $260,700 | $95,800 | $164,900 |
| 2023 | $1,921 | $228,800 | $61,500 | $167,300 |
| 2022 | $1,749 | $182,400 | $49,000 | $133,400 |
| 2021 | $1,695 | $182,400 | $49,000 | $133,400 |
| 2020 | $1,590 | $162,100 | $46,800 | $115,300 |
| 2019 | $1,354 | $142,600 | $46,800 | $95,800 |
| 2018 | $1,480 | $133,100 | $39,000 | $94,100 |
| 2017 | $1,326 | $130,600 | $39,000 | $91,600 |
| 2016 | $1,247 | $113,600 | $46,800 | $66,800 |
| 2015 | $1,124 | $106,800 | $40,000 | $66,800 |
| 2013 | $1,124 | $105,700 | $40,000 | $65,700 |
Source: Public Records
Map
Nearby Homes
- 154 SW 11th St
- 1149 SW Cascade Ave
- 739 SW Pacific Ave
- 1034 S Market Blvd
- 765 SW Chehalis Ave
- 1024 SE Adams Ave
- 226 SW 16th St
- 1492 SW Kelly Ave
- 0 SE Evergreen Dr Unit NWM2297951
- 262 SW 2nd St
- 130 SW 2nd St
- 0 SE Summit Rd Unit NWM2316477
- 417 SE Parkhill Dr
- 425 SE Hilltop Dr
- 1615 SW Snively Ave
- 226 SW Lewis St
- 0 SE Carlesta Ave Unit NWM2417104
- 535 SW 19th St
- 680 SE Prospect St
- 602 SW 19th St
- 1057 SW Cascade Ave
- 241 SW 10th St
- 1017 SW Cascade Ave
- 259 SW 10th St
- 244 SW 11th St
- 1121 SW Cascade Ave
- 260 SW 11th St
- 274 SW 11th St
- 1040 SW William Ave
- 981 SW Cascade Ave
- 1040 SW Cascade Ave
- 1022 SW Cascade Ave
- 1060 SW Cascade Ave
- 282 SW 11th St
- 1080 SW Cascade Ave
- 977 SW Cascade Ave
- 980 SW William Ave
- 219 SW 11th St
- 978 SW Cascade Ave
Your Personal Tour Guide
Ask me questions while you tour the home.