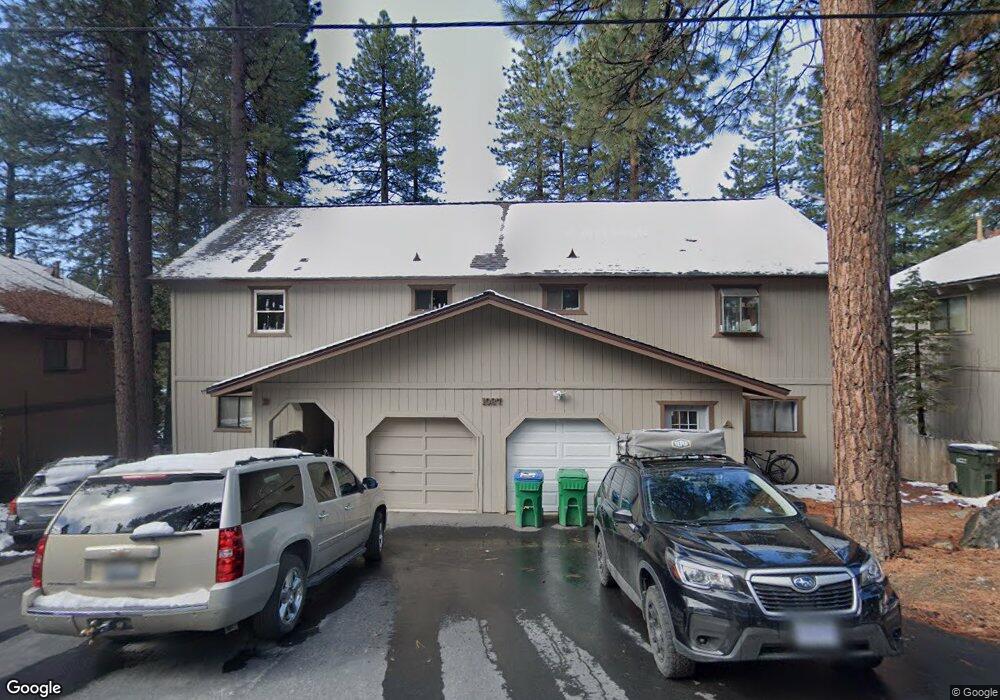
1037 Tomahawk Trail Unit 1 Incline Village, NV 89451
Estimated Value: $619,000 - $831,000
3
Beds
2
Baths
1,578
Sq Ft
$462/Sq Ft
Est. Value
About This Home
This home is located at 1037 Tomahawk Trail Unit 1, Incline Village, NV 89451 and is currently estimated at $729,239, approximately $462 per square foot. 1037 Tomahawk Trail Unit 1 is a home located in Washoe County with nearby schools including Incline Elementary School, Incline Middle School, and Incline High School.
Ownership History
Date
Name
Owned For
Owner Type
Purchase Details
Closed on
Aug 6, 2007
Sold by
Tenir Llc
Bought by
Schmidtbauer Kerry L
Current Estimated Value
Home Financials for this Owner
Home Financials are based on the most recent Mortgage that was taken out on this home.
Original Mortgage
$150,000
Outstanding Balance
$95,360
Interest Rate
6.74%
Mortgage Type
Unknown
Estimated Equity
$633,879
Purchase Details
Closed on
Jul 17, 2007
Sold by
Taylor Scot Ray and Taylor Sandra Lucia
Bought by
Tenir Llc
Home Financials for this Owner
Home Financials are based on the most recent Mortgage that was taken out on this home.
Original Mortgage
$150,000
Outstanding Balance
$95,360
Interest Rate
6.74%
Mortgage Type
Unknown
Estimated Equity
$633,879
Purchase Details
Closed on
May 23, 2000
Sold by
Nerlove Gerald
Bought by
Taylor Scot Ray and Taylor Sandra Lucia
Home Financials for this Owner
Home Financials are based on the most recent Mortgage that was taken out on this home.
Original Mortgage
$178,002
Interest Rate
8.67%
Create a Home Valuation Report for This Property
The Home Valuation Report is an in-depth analysis detailing your home's value as well as a comparison with similar homes in the area
Home Values in the Area
Average Home Value in this Area
Purchase History
| Date | Buyer | Sale Price | Title Company |
|---|---|---|---|
| Schmidtbauer Kerry L | $323,000 | First American Title | |
| Tenir Llc | $322,500 | First American Title | |
| Taylor Scot Ray | $198,000 | Stewart Title Northern Nevad |
Source: Public Records
Mortgage History
| Date | Status | Borrower | Loan Amount |
|---|---|---|---|
| Open | Schmidtbauer Kerry L | $150,000 | |
| Previous Owner | Taylor Scot Ray | $178,002 |
Source: Public Records
Tax History Compared to Growth
Tax History
| Year | Tax Paid | Tax Assessment Tax Assessment Total Assessment is a certain percentage of the fair market value that is determined by local assessors to be the total taxable value of land and additions on the property. | Land | Improvement |
|---|---|---|---|---|
| 2025 | $2,116 | $88,108 | $58,937 | $29,172 |
| 2024 | $2,116 | $83,250 | $52,353 | $30,897 |
| 2023 | $1,999 | $77,693 | $49,865 | $27,829 |
| 2022 | $2,279 | $67,208 | $41,265 | $25,943 |
| 2021 | $2,235 | $52,013 | $25,799 | $26,214 |
| 2020 | $2,241 | $54,366 | $27,878 | $26,488 |
| 2019 | $2,200 | $49,690 | $23,594 | $26,096 |
| 2018 | $2,160 | $41,057 | $15,278 | $25,779 |
| 2017 | $2,121 | $40,669 | $14,837 | $25,832 |
| 2016 | $2,089 | $41,166 | $14,585 | $26,581 |
| 2015 | $2,086 | $36,337 | $10,553 | $25,784 |
| 2014 | $2,061 | $36,842 | $10,553 | $26,289 |
| 2013 | -- | $34,733 | $8,820 | $25,913 |
Source: Public Records
Map
Nearby Homes
- 1049 Tomahawk Trail
- 1055 Tomahawk Trail Unit A and B
- 1055 Tomahawk Trail
- 321 Ski Way Unit 161
- 321 Ski Way Unit 71
- 321 Ski Way Unit 243
- 321 Ski Way Unit 24
- 321 Ski Way Unit 197
- 333 Ski Way Unit 253
- 1088 Lucerne Way
- 1064 Lucerne Way
- 250 Pine Cone Rd
- 1090 Mill Creek Rd
- 1075 Mill Creek Rd
- 1128 Lucerne Way Unit 7
- 198 Country Club Dr Unit 35
- 1042 Lakeshore Blvd
- 989 Tahoe Blvd Unit 61
- 989 Tahoe Blvd Unit 71
- 989 Tahoe Blvd Unit 77
- 1037 Tomahawk Trail Unit 2
- 1035 Tomahawk Trail
- 1039 Tomahawk Trail
- 1032 Tomahawk Trail
- 1033 Tomahawk Trail
- 1034 Tomahawk Trail
- 1030 Tomahawk Trail
- 1041 Tomahawk Trail
- 1036 Tomahawk Trail Unit 1
- 1036 Tomahawk Trail Unit 2
- 1029 Tomahawk Trail
- 1026 Tomahawk Trail
- 1043 Tomahawk Trail
- 1043 Tomahawk Trail Unit 1 & 2
- 1034 War Bonnet Way
- 1032 War Bonnet Way
- 1036 War Bonnet Way Unit 1
- 1036 War Bonnet Way
- 1036 War Bonnet Way Unit A
- 1022 Tomahawk Trail