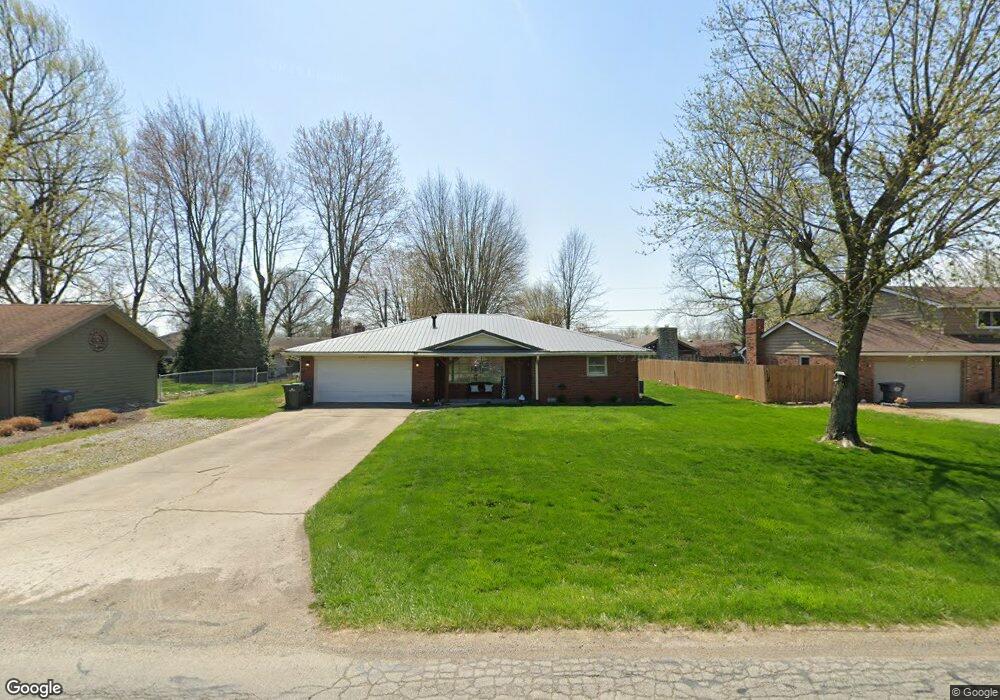
1037 W 300 N Anderson, IN 46011
Estimated Value: $209,000 - $287,000
3
Beds
2
Baths
1,740
Sq Ft
$137/Sq Ft
Est. Value
About This Home
This home is located at 1037 W 300 N, Anderson, IN 46011 and is currently estimated at $238,231, approximately $136 per square foot. 1037 W 300 N is a home located in Madison County with nearby schools including Frankton Elementary School, Frankton Junior/Senior High School, and Excel Center - Anderson.
Ownership History
Date
Name
Owned For
Owner Type
Purchase Details
Closed on
May 31, 2018
Sold by
Ginder David R and Ginder Pamela Sue
Bought by
Sayre Makenzi D
Current Estimated Value
Home Financials for this Owner
Home Financials are based on the most recent Mortgage that was taken out on this home.
Original Mortgage
$78,059
Outstanding Balance
$67,309
Interest Rate
4.37%
Mortgage Type
FHA
Estimated Equity
$170,922
Purchase Details
Closed on
Mar 31, 2018
Sold by
Ginder
Bought by
Sayre Makenzi D
Create a Home Valuation Report for This Property
The Home Valuation Report is an in-depth analysis detailing your home's value as well as a comparison with similar homes in the area
Home Values in the Area
Average Home Value in this Area
Purchase History
| Date | Buyer | Sale Price | Title Company |
|---|---|---|---|
| Sayre Makenzi D | -- | Fidelity National Title | |
| Sayre Makenzi D | $79,500 | -- |
Source: Public Records
Mortgage History
| Date | Status | Borrower | Loan Amount |
|---|---|---|---|
| Open | Sayre Makenzi D | $78,059 |
Source: Public Records
Tax History Compared to Growth
Tax History
| Year | Tax Paid | Tax Assessment Tax Assessment Total Assessment is a certain percentage of the fair market value that is determined by local assessors to be the total taxable value of land and additions on the property. | Land | Improvement |
|---|---|---|---|---|
| 2024 | $852 | $112,100 | $15,200 | $96,900 |
| 2023 | $772 | $102,500 | $14,500 | $88,000 |
| 2022 | $858 | $101,300 | $13,300 | $88,000 |
| 2021 | $712 | $94,200 | $13,300 | $80,900 |
| 2020 | $711 | $89,300 | $12,800 | $76,500 |
| 2019 | $644 | $87,100 | $12,800 | $74,300 |
| 2018 | $583 | $79,600 | $12,800 | $66,800 |
| 2017 | $1,698 | $84,800 | $12,800 | $72,000 |
| 2016 | $1,718 | $85,300 | $12,800 | $72,500 |
| 2014 | $1,656 | $82,700 | $12,800 | $69,900 |
| 2013 | $1,656 | $82,700 | $12,800 | $69,900 |
Source: Public Records
Map
Nearby Homes
- 1053 W 300 N
- 601 Belzer Dr
- 2915 W Hartman Rd
- 2413 Silver St
- 391 W 375 N
- 143 E School St
- 2334 Poplar St
- 305 Mohawk St
- 2717 Apache Dr
- 1907 Lowell Ave
- 1820 Whittier Ave
- 2722 Dakota Dr
- 2976 N Scatterfield Rd
- 2132 Poplar St
- 1905 E Balsam Ct
- 2030 Broadway St
- 718 Hawthorne Ave
- 135 Amber Dr
- 2003 Crystal St
- 724 Iroquois St