1037 W Knickerbocker Dr Sunnyvale, CA 94087
Estimated Value: $2,405,000 - $3,315,000
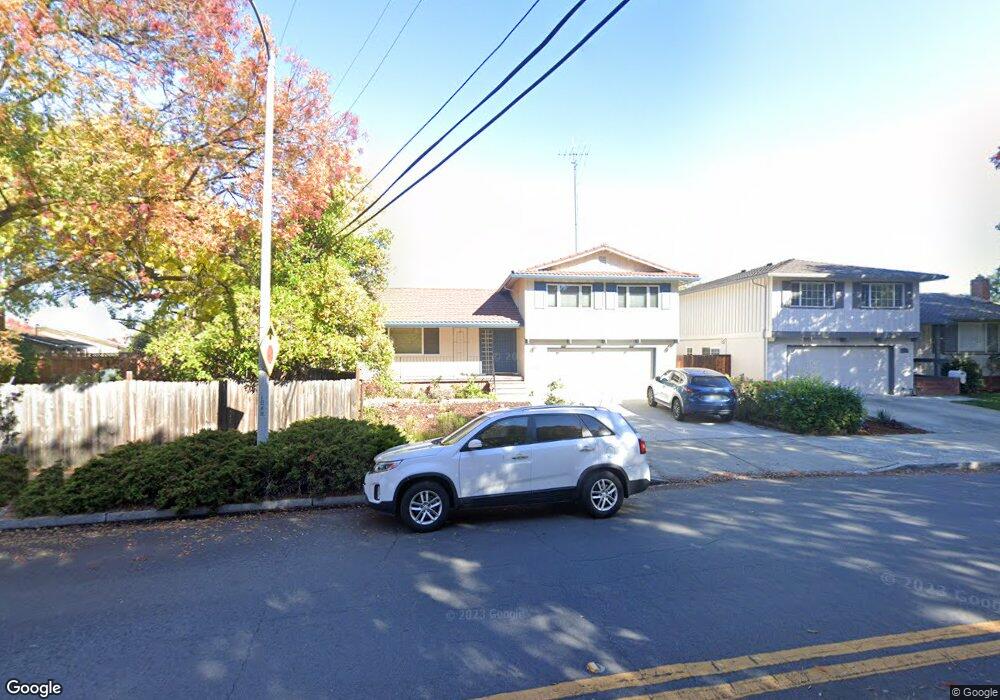
About This Home
This home is located at 1037 W Knickerbocker Dr, Sunnyvale, CA 94087 and is currently estimated at $2,887,806, approximately $1,618 per square foot. 1037 W Knickerbocker Dr is a home located in Santa Clara County with nearby schools including Cherry Chase Elementary School, Sunnyvale Middle School, and Homestead High School.
Ownership History
We collect this data history from publicly available records. To have your information removed, we recommend requesting removal directly through your county’s website.
Purchase Details
Home Financials for this Owner
Home Financials are based on the most recent Mortgage that was taken out on this home.Purchase Details
Home Financials for this Owner
Home Financials are based on the most recent Mortgage that was taken out on this home.Purchase History
We collect this data history from publicly available records. To have your information removed, we recommend requesting removal directly through your county’s website.
| Date | Buyer | Sale Price | Title Company |
|---|---|---|---|
| $1,070,000 | Chicago Title Company | ||
| $346,000 | Gateway Title Company |
Mortgage History
We collect this data history from publicly available records. To have your information removed, we recommend requesting removal directly through your county’s website.
| Date | Status | Borrower | Loan Amount |
|---|---|---|---|
| Open | $500,000 | ||
| Previous Owner | $311,200 |
Tax History
We collect this data history from publicly available records. To have your information removed, we recommend requesting removal directly through your county’s website.
| Year | Tax Paid | Tax Assessment Tax Assessment Total Assessment is a certain percentage of the fair market value that is determined by local assessors to be the total taxable value of land and additions on the property. | Land | Improvement |
|---|---|---|---|---|
| 2025 | $16,411 | $1,433,561 | $1,075,175 | $358,386 |
| 2024 | $16,411 | $1,405,453 | $1,054,094 | $351,359 |
| 2023 | $16,260 | $1,377,896 | $1,033,426 | $344,470 |
| 2022 | $15,994 | $1,350,879 | $1,013,163 | $337,716 |
| 2021 | $15,842 | $1,324,393 | $993,298 | $331,095 |
| 2020 | $15,643 | $1,310,814 | $983,113 | $327,701 |
| 2019 | $15,290 | $1,285,113 | $963,837 | $321,276 |
| 2018 | $14,998 | $1,259,916 | $944,939 | $314,977 |
| 2017 | $14,804 | $1,235,212 | $926,411 | $308,801 |
| 2016 | $14,232 | $1,210,994 | $908,247 | $302,747 |
| 2015 | $14,315 | $1,192,805 | $894,605 | $298,200 |
| 2014 | $14,031 | $1,169,440 | $877,081 | $292,359 |
Map
- 884 S Mary Ave
- 841 Peach Ave
- 852 Peach Ave
- 1091 Rockefeller Dr
- 804 Piper Ave
- 1233 Lime Dr
- 2740 Ramos Ct
- 809 Runningwood Cir
- 814 Hollenbeck Ave
- 1033 Crestview Dr Unit 110
- 2725 Fairbrook Dr
- 1031 Crestview Dr Unit 305
- 1031 Crestview Dr Unit 106
- 1142 Viscaino Ave
- 1265 Riesling Terrace
- 1354 Dale Ave Unit 9
- 618 Sheraton Dr
- 377 S Mary Ave
- 13220 Franklin Ave
- 705 W Fremont Ave Unit 3
- 922 Mango Ave
- 916 Mango Ave
- 928 Mango Ave
- 1036 Kenbridge Ct
- 1032 Kenbridge Ct
- 910 Mango Ave
- 923 Mango Ave
- 931 Mango Ave
- 915 Mango Ave
- 904 Mango Ave
- 1033 W Knickerbocker Dr
- 1035 Kenbridge Ct
- 1028 Kenbridge Ct
- 909 Mango Ave
- 1004 Mango Ave
- 903 Mango Ave
- 898 Mango Ave
- 1031 Kenbridge Ct
- 1003 Mango Ave
- 1029 W Knickerbocker Dr
Ask me questions while you tour the home.