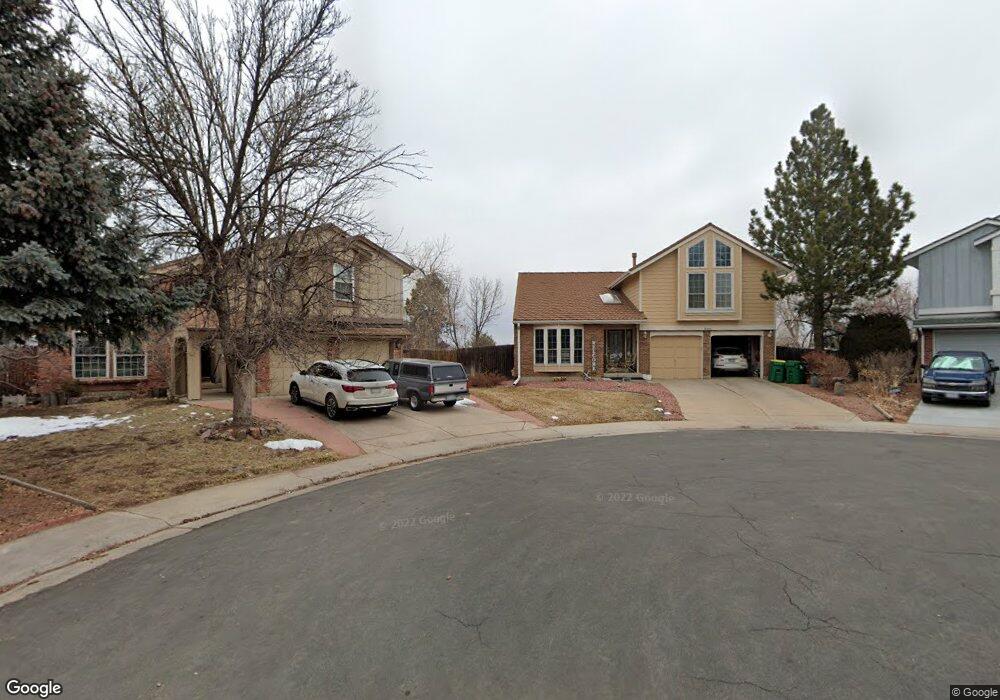
10375 Julian Ct Westminster, CO 80031
Hyland Greens NeighborhoodEstimated Value: $670,635 - $787,000
4
Beds
3
Baths
2,698
Sq Ft
$270/Sq Ft
Est. Value
About This Home
This home is located at 10375 Julian Ct, Westminster, CO 80031 and is currently estimated at $728,409, approximately $269 per square foot. 10375 Julian Ct is a home located in Adams County with nearby schools including Rocky Mountain Elementary School, Silver Hills Middle School, and Northglenn High School.
Ownership History
Date
Name
Owned For
Owner Type
Purchase Details
Closed on
Jan 10, 2001
Sold by
Owen Clara M
Bought by
Price Lloyd T and Price Joann
Current Estimated Value
Purchase Details
Closed on
Jul 18, 2000
Sold by
And Grebenc Daniel F and Grebenc Bridget M
Bought by
Price Lloyd T and Price Joann
Home Financials for this Owner
Home Financials are based on the most recent Mortgage that was taken out on this home.
Original Mortgage
$212,000
Interest Rate
8.36%
Purchase Details
Closed on
Jan 26, 1995
Sold by
Dabasinskas John R and Dabasinskas Jeannie M
Bought by
Grebenc Daniel F and Grebenc Bridget M
Home Financials for this Owner
Home Financials are based on the most recent Mortgage that was taken out on this home.
Original Mortgage
$162,000
Interest Rate
9.13%
Purchase Details
Closed on
Jul 7, 1993
Create a Home Valuation Report for This Property
The Home Valuation Report is an in-depth analysis detailing your home's value as well as a comparison with similar homes in the area
Home Values in the Area
Average Home Value in this Area
Purchase History
| Date | Buyer | Sale Price | Title Company |
|---|---|---|---|
| Price Lloyd T | $50,000 | -- | |
| Price Lloyd T | $265,000 | Land Title Guarantee Company | |
| Grebenc Daniel F | $180,000 | Land Title | |
| -- | $165,000 | -- |
Source: Public Records
Mortgage History
| Date | Status | Borrower | Loan Amount |
|---|---|---|---|
| Previous Owner | Price Lloyd T | $212,000 | |
| Previous Owner | Grebenc Daniel F | $162,000 |
Source: Public Records
Tax History Compared to Growth
Tax History
| Year | Tax Paid | Tax Assessment Tax Assessment Total Assessment is a certain percentage of the fair market value that is determined by local assessors to be the total taxable value of land and additions on the property. | Land | Improvement |
|---|---|---|---|---|
| 2024 | $3,476 | $39,500 | $8,440 | $31,060 |
| 2023 | $3,439 | $45,800 | $8,120 | $37,680 |
| 2022 | $2,707 | $32,700 | $8,340 | $24,360 |
| 2021 | $2,795 | $32,700 | $8,340 | $24,360 |
| 2020 | $2,823 | $33,670 | $8,580 | $25,090 |
| 2019 | $2,828 | $33,670 | $8,580 | $25,090 |
| 2018 | $3,242 | $29,400 | $8,640 | $20,760 |
| 2017 | $2,925 | $29,400 | $8,640 | $20,760 |
| 2016 | $2,652 | $25,850 | $4,940 | $20,910 |
| 2015 | $2,649 | $25,850 | $4,940 | $20,910 |
| 2014 | -- | $25,000 | $4,540 | $20,460 |
Source: Public Records
Map
Nearby Homes
- 3743 W 103rd Dr
- 3795 W 104th Dr Unit A
- 3086 W 107th Place Unit F
- 10641 King Ct
- 3090 W 107th Place Unit C
- 10699 Hobbit Ln
- 10003 Irving St
- 3022 W 107th Place Unit D
- 10762 Julian Ct
- 10114 Meade Ct
- 3985 W 104th Dr Unit E
- 3061 W 107th Place Unit F
- 3770 W 101st Ave
- 10058 Grove Ct Unit E
- 3938 W 102nd Ave
- 3656 W 100th Ave
- 3001 W 107th Place Unit D
- 3953 W 102nd Ave
- 3756 W 100th Ave
- 10725 Eliot Cir Unit 201
- 10365 Julian Ct
- 10374 Julian Ct
- 10355 Julian Ct
- 10364 Julian Ct
- 10368 King Ct
- 10354 Julian Ct
- 10378 King Ct
- 10358 King Ct
- 10373 Irving Ct
- 10363 Irving Ct
- 10332 Julian St
- 10388 King Ct
- 3380 Northpark Dr
- 10353 Irving Ct
- 10401 King Cir
- 10345 Julian St
- 10383 Irving Ct
- 10322 Julian St
- 3360 Northpark Dr
- 10335 Julian St