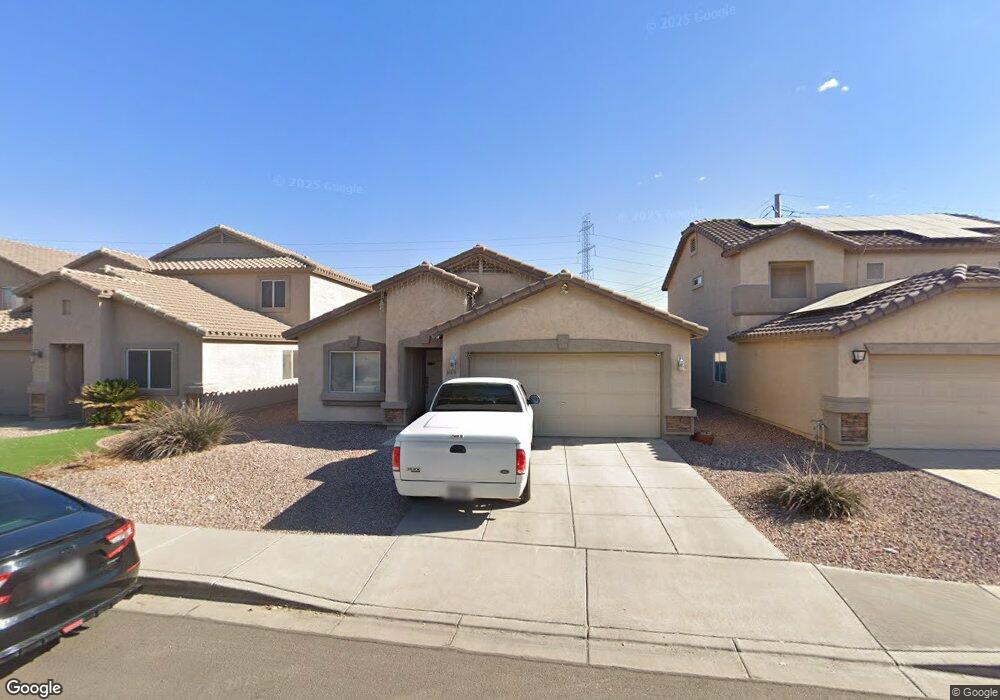
10379 N 115th Dr Youngtown, AZ 85363
Estimated Value: $336,470 - $385,000
--
Bed
3
Baths
1,714
Sq Ft
$216/Sq Ft
Est. Value
About This Home
This home is located at 10379 N 115th Dr, Youngtown, AZ 85363 and is currently estimated at $370,118, approximately $215 per square foot. 10379 N 115th Dr is a home located in Maricopa County with nearby schools including Luke Elementary School, Dysart High School, and Desert Mirage Elementary School.
Ownership History
Date
Name
Owned For
Owner Type
Purchase Details
Closed on
Mar 19, 2024
Sold by
Cortinas Jessica A
Bought by
Cortinas Jessica A
Current Estimated Value
Home Financials for this Owner
Home Financials are based on the most recent Mortgage that was taken out on this home.
Original Mortgage
$306,878
Outstanding Balance
$301,774
Interest Rate
6.63%
Mortgage Type
FHA
Estimated Equity
$68,344
Purchase Details
Closed on
Apr 22, 2005
Sold by
Cortinas Raymond E
Bought by
Cortinas Jessica A
Home Financials for this Owner
Home Financials are based on the most recent Mortgage that was taken out on this home.
Original Mortgage
$28,684
Interest Rate
5.99%
Mortgage Type
Credit Line Revolving
Create a Home Valuation Report for This Property
The Home Valuation Report is an in-depth analysis detailing your home's value as well as a comparison with similar homes in the area
Home Values in the Area
Average Home Value in this Area
Purchase History
| Date | Buyer | Sale Price | Title Company |
|---|---|---|---|
| Cortinas Jessica A | -- | Servicelink | |
| Cortinas Jessica A | -- | Sun Title Agency Co | |
| Cortinas Jessica A | $191,230 | Sun Title Agency Co |
Source: Public Records
Mortgage History
| Date | Status | Borrower | Loan Amount |
|---|---|---|---|
| Open | Cortinas Jessica A | $306,878 | |
| Previous Owner | Cortinas Jessica A | $28,684 | |
| Previous Owner | Cortinas Jessica A | $28,684 | |
| Previous Owner | Cortinas Jessica A | $152,984 |
Source: Public Records
Tax History Compared to Growth
Tax History
| Year | Tax Paid | Tax Assessment Tax Assessment Total Assessment is a certain percentage of the fair market value that is determined by local assessors to be the total taxable value of land and additions on the property. | Land | Improvement |
|---|---|---|---|---|
| 2025 | $1,732 | $12,058 | -- | -- |
| 2024 | $1,636 | $11,484 | -- | -- |
| 2023 | $1,636 | $26,500 | $5,300 | $21,200 |
| 2022 | $1,487 | $20,420 | $4,080 | $16,340 |
| 2021 | $1,498 | $18,820 | $3,760 | $15,060 |
| 2020 | $1,473 | $17,380 | $3,470 | $13,910 |
| 2019 | $1,415 | $15,510 | $3,100 | $12,410 |
| 2018 | $1,415 | $13,720 | $2,740 | $10,980 |
| 2017 | $1,441 | $12,350 | $2,470 | $9,880 |
| 2016 | $1,371 | $11,720 | $2,340 | $9,380 |
| 2015 | $1,363 | $10,600 | $2,120 | $8,480 |
Source: Public Records
Map
Nearby Homes
- 11534 W Longley Ln
- 11622 W Brown St
- 11590 W Mountain View Rd
- 11566 W Purdue Ave
- 10287 N 115th Ave
- Payson Plan at Ridgeview
- 10299 N 115th Ave
- Taos Plan at Ridgeview
- Bisbee Plan at Ridgeview
- 10293 N 115th Ave
- 11553 W Purdue Ave
- 11627 W Hackbarth Dr
- 10311 N 115th Ave
- 11589 W Lee Ln
- 10317 N 115th Ave
- 10329 N 115th Ave
- 11513 W Arron Dr
- 11563 W Palo Verde Ave
- 11588 W Lee Ln
- 10341 N 115th Ave
- 10373 N 115th Dr
- 10385 N 115th Dr
- 10367 N 115th Dr
- 10391 N 115th Dr
- 10361 N 115th Dr
- 10397 N 115th Dr
- 11537 W Cheryl Dr
- 11538 W Brown St
- 10355 N 115th Dr
- 10403 N 115th Dr
- 11543 W Cheryl Dr
- 11544 W Brown St
- 11536 W Cheryl Dr
- 10409 N 115th Dr
- 11549 W Cheryl Dr
- 11550 W Brown St
- 10349 N 115th Dr
- 11542 W Cheryl Dr
- 11541 W Brown St
- 11541 W Brown St