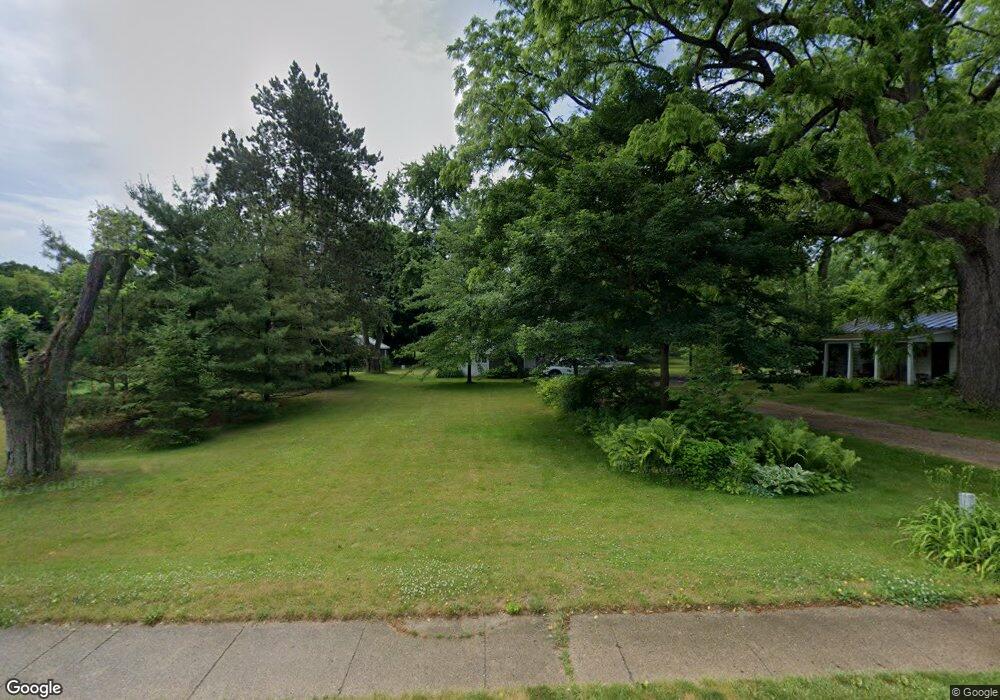
1038 129th Ave Wayland, MI 49348
Estimated Value: $293,000 - $342,000
--
Bed
1
Bath
1,572
Sq Ft
$200/Sq Ft
Est. Value
About This Home
This home is located at 1038 129th Ave, Wayland, MI 49348 and is currently estimated at $314,753, approximately $200 per square foot. 1038 129th Ave is a home located in Allegan County with nearby schools including Wayland High School and St. Therese Catholic School.
Ownership History
Date
Name
Owned For
Owner Type
Purchase Details
Closed on
Mar 3, 2006
Sold by
Fox Todd M and Fox Julie A
Bought by
Fox Todd M and Fox Julie A
Current Estimated Value
Purchase Details
Closed on
Aug 25, 1997
Sold by
Fox Ruth
Bought by
Fox Todd and Fox Julie
Create a Home Valuation Report for This Property
The Home Valuation Report is an in-depth analysis detailing your home's value as well as a comparison with similar homes in the area
Home Values in the Area
Average Home Value in this Area
Purchase History
| Date | Buyer | Sale Price | Title Company |
|---|---|---|---|
| Fox Todd M | -- | None Available | |
| Fox Todd | $55,000 | -- |
Source: Public Records
Tax History Compared to Growth
Tax History
| Year | Tax Paid | Tax Assessment Tax Assessment Total Assessment is a certain percentage of the fair market value that is determined by local assessors to be the total taxable value of land and additions on the property. | Land | Improvement |
|---|---|---|---|---|
| 2025 | $1,734 | $137,400 | $28,800 | $108,600 |
| 2024 | $1,508 | $128,800 | $28,500 | $100,300 |
| 2023 | $1,546 | $93,800 | $27,000 | $66,800 |
| 2022 | $1,508 | $71,900 | $14,900 | $57,000 |
| 2021 | $1,412 | $66,800 | $14,900 | $51,900 |
| 2020 | $1,374 | $68,200 | $13,500 | $54,700 |
| 2019 | $1,364 | $56,000 | $13,500 | $42,500 |
| 2018 | $669 | $53,600 | $16,100 | $37,500 |
| 2017 | $0 | $54,100 | $16,100 | $38,000 |
| 2016 | $0 | $50,800 | $15,500 | $35,300 |
| 2015 | -- | $50,800 | $15,500 | $35,300 |
| 2014 | -- | $44,700 | $16,400 | $28,300 |
| 2013 | -- | $42,000 | $16,400 | $25,600 |
Source: Public Records
Map
Nearby Homes
- 1130 128th Ave
- 1116 128th Ave
- 986 129th Ave
- 2681 Geneva Lake Dr S
- V/L 10th St
- 2841 Odawa Trail
- 3296 Stonehill Ct
- 3282 Stonehill Ct
- 988 124th Ave
- 3214 7th St
- 590 129th Ave
- 621 S Main St
- 319 Alpine St
- 330 Lotz Ct
- 219 Alpine St
- 110 E Sycamore St
- 835 Wild Flower Ct
- 146 Hanlon Ct
- 401 Anderson Dr
- 212 E Superior St