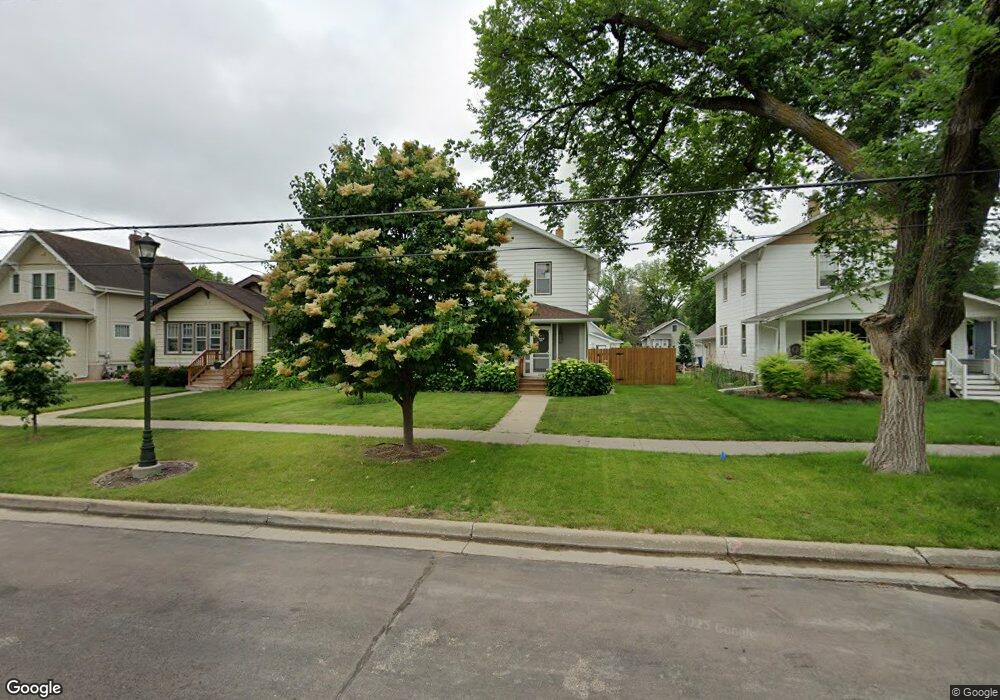
1038 3rd St N Fargo, ND 58102
Horace Mann NeighborhoodEstimated Value: $241,000 - $250,000
3
Beds
1
Bath
1,928
Sq Ft
$127/Sq Ft
Est. Value
About This Home
This home is located at 1038 3rd St N, Fargo, ND 58102 and is currently estimated at $244,580, approximately $126 per square foot. 1038 3rd St N is a home located in Cass County with nearby schools including Horace Mann Roosevelt Elementary School, Ben Franklin Middle School, and North High School.
Ownership History
Date
Name
Owned For
Owner Type
Purchase Details
Closed on
Nov 11, 2024
Sold by
Starkey Jacob D and Starkey Heather E
Bought by
Starkey Properties Llc
Current Estimated Value
Purchase Details
Closed on
Jul 20, 2017
Sold by
Cole Matthew and Cole Katie
Bought by
Starkey Jacob D and Starkey Heather E
Home Financials for this Owner
Home Financials are based on the most recent Mortgage that was taken out on this home.
Original Mortgage
$151,771
Interest Rate
3.89%
Mortgage Type
New Conventional
Purchase Details
Closed on
Feb 11, 2015
Sold by
Kerzman Michael J
Bought by
Cole Matthew and Cole Katie
Home Financials for this Owner
Home Financials are based on the most recent Mortgage that was taken out on this home.
Original Mortgage
$149,246
Interest Rate
4.1%
Mortgage Type
FHA
Purchase Details
Closed on
May 31, 2005
Sold by
Bergem Christopher R and Bergem Jessica
Bought by
Kerzman Michael J
Home Financials for this Owner
Home Financials are based on the most recent Mortgage that was taken out on this home.
Original Mortgage
$118,950
Interest Rate
5.35%
Mortgage Type
FHA
Create a Home Valuation Report for This Property
The Home Valuation Report is an in-depth analysis detailing your home's value as well as a comparison with similar homes in the area
Home Values in the Area
Average Home Value in this Area
Purchase History
| Date | Buyer | Sale Price | Title Company |
|---|---|---|---|
| Starkey Properties Llc | -- | None Listed On Document | |
| Starkey Properties Llc | -- | None Listed On Document | |
| Starkey Jacob D | $168,635 | Title Co | |
| Cole Matthew | -- | Northern Title Co | |
| Kerzman Michael J | -- | -- |
Source: Public Records
Mortgage History
| Date | Status | Borrower | Loan Amount |
|---|---|---|---|
| Previous Owner | Starkey Jacob D | $151,771 | |
| Previous Owner | Cole Matthew | $149,246 | |
| Previous Owner | Kerzman Michael J | $118,950 |
Source: Public Records
Tax History
| Year | Tax Paid | Tax Assessment Tax Assessment Total Assessment is a certain percentage of the fair market value that is determined by local assessors to be the total taxable value of land and additions on the property. | Land | Improvement |
|---|---|---|---|---|
| 2024 | $3,343 | $124,150 | $19,200 | $104,950 |
| 2023 | $3,443 | $109,850 | $19,200 | $90,650 |
| 2022 | $3,196 | $98,950 | $19,200 | $79,750 |
| 2021 | $2,907 | $89,950 | $19,200 | $70,750 |
| 2020 | $2,199 | $81,750 | $19,200 | $62,550 |
| 2019 | $2,201 | $81,750 | $11,400 | $70,350 |
| 2018 | $2,379 | $89,700 | $11,400 | $78,300 |
| 2017 | $5,174 | $85,450 | $11,400 | $74,050 |
| 2016 | $2,004 | $82,950 | $11,400 | $71,550 |
| 2015 | $1,860 | $74,000 | $7,800 | $66,200 |
| 2014 | $2,930 | $67,250 | $7,800 | $59,450 |
| 2013 | $2,008 | $65,300 | $7,800 | $57,500 |
Source: Public Records
Map
Nearby Homes
- 921 4th St N
- 1125 5th St N
- 1002 5th St N
- 1119 Broadway N
- 902-904 N 1st Street North St N
- 915 Broadway N
- 804 3rd St N
- 1120 Broadway N
- 624 10th Ave N
- 628 10th Ave N
- 727 3rd St N
- 1257 4th St N
- 1249 2nd St N
- 1245 1st St N
- 722 9th Ave N
- 809 11th Ave N
- 714 Oak St N
- 730 Elm St N Unit B1
- 1119 9th St N
- 1345 4th St N
Your Personal Tour Guide
Ask me questions while you tour the home.