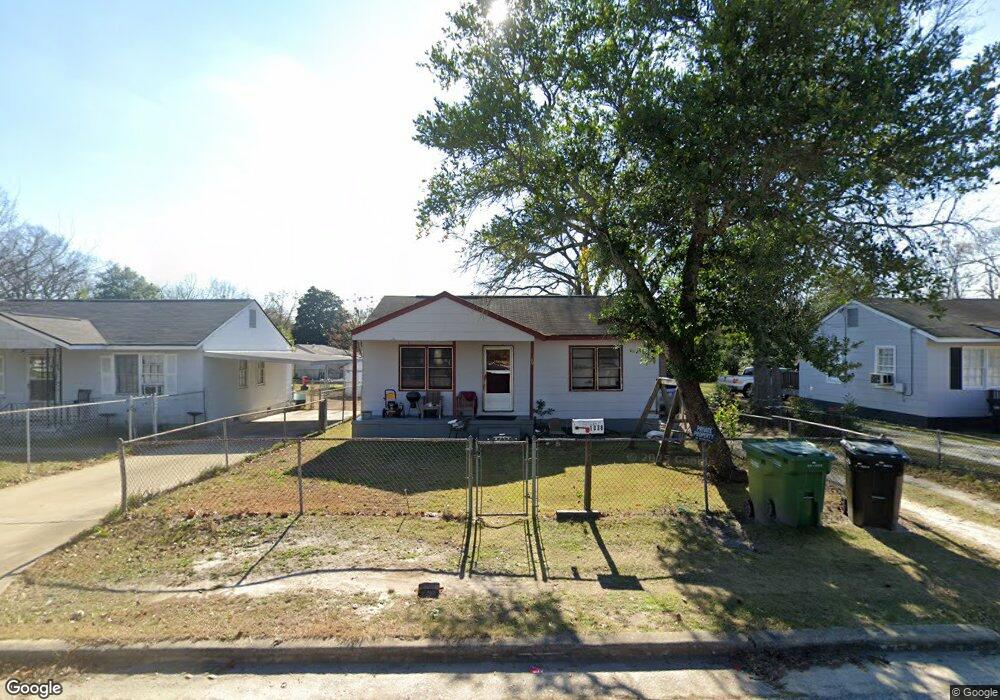
1038 43rd St Columbus, GA 31904
North Highlands NeighborhoodEstimated Value: $47,000 - $68,000
3
Beds
2
Baths
1,006
Sq Ft
$59/Sq Ft
Est. Value
About This Home
This home is located at 1038 43rd St, Columbus, GA 31904 and is currently estimated at $59,684, approximately $59 per square foot. 1038 43rd St is a home located in Muscogee County with nearby schools including Johnson Elementary School, Arnold Middle School, and Jordan Vocational High School.
Ownership History
Date
Name
Owned For
Owner Type
Purchase Details
Closed on
Feb 25, 2022
Sold by
Wayne Starling Richard
Bought by
Starling Charles E
Current Estimated Value
Home Financials for this Owner
Home Financials are based on the most recent Mortgage that was taken out on this home.
Original Mortgage
$21,435
Outstanding Balance
$19,315
Interest Rate
1.5%
Mortgage Type
New Conventional
Estimated Equity
$40,369
Purchase Details
Closed on
Apr 25, 2017
Sold by
Reedy Billy H
Bought by
Starling Richard Wayne
Create a Home Valuation Report for This Property
The Home Valuation Report is an in-depth analysis detailing your home's value as well as a comparison with similar homes in the area
Home Values in the Area
Average Home Value in this Area
Purchase History
| Date | Buyer | Sale Price | Title Company |
|---|---|---|---|
| Starling Charles E | -- | None Listed On Document | |
| Starling Richard Wayne | $21,000 | -- |
Source: Public Records
Mortgage History
| Date | Status | Borrower | Loan Amount |
|---|---|---|---|
| Open | Starling Charles E | $21,435 |
Source: Public Records
Tax History Compared to Growth
Tax History
| Year | Tax Paid | Tax Assessment Tax Assessment Total Assessment is a certain percentage of the fair market value that is determined by local assessors to be the total taxable value of land and additions on the property. | Land | Improvement |
|---|---|---|---|---|
| 2025 | $879 | $22,444 | $5,080 | $17,364 |
| 2024 | $879 | $22,444 | $5,080 | $17,364 |
| 2023 | $733 | $18,596 | $5,080 | $13,516 |
| 2022 | $470 | $11,500 | $3,556 | $7,944 |
| 2021 | $222 | $5,444 | $3,556 | $1,888 |
| 2020 | $222 | $5,444 | $3,556 | $1,888 |
| 2019 | $223 | $5,444 | $3,556 | $1,888 |
| 2018 | $223 | $5,444 | $3,556 | $1,888 |
| 2017 | $580 | $14,100 | $3,556 | $10,544 |
| 2016 | $549 | $13,308 | $1,800 | $11,508 |
| 2015 | $220 | $13,308 | $1,800 | $11,508 |
| 2014 | $550 | $13,308 | $1,800 | $11,508 |
| 2013 | -- | $13,308 | $1,800 | $11,508 |
Source: Public Records
Map
Nearby Homes