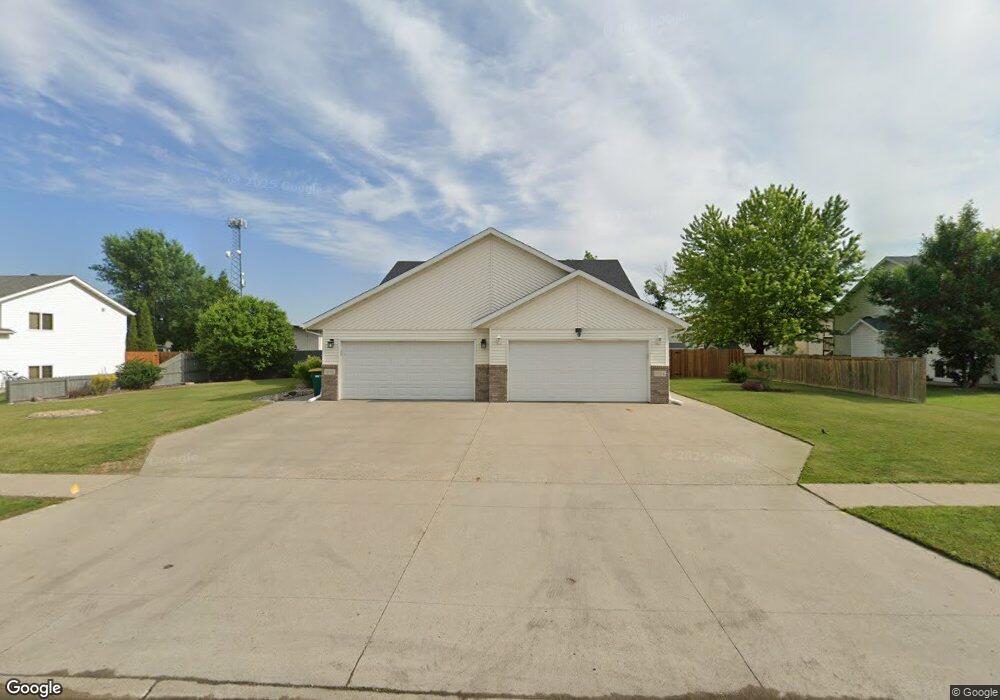
1038 4th Ave W West Fargo, ND 58078
West Side NeighborhoodEstimated Value: $290,000 - $294,749
3
Beds
2
Baths
1,750
Sq Ft
$167/Sq Ft
Est. Value
About This Home
This home is located at 1038 4th Ave W, West Fargo, ND 58078 and is currently estimated at $292,375, approximately $167 per square foot. 1038 4th Ave W is a home located in Cass County with nearby schools including Westside Elementary School, Cheney Middle School, and West Fargo High School.
Ownership History
Date
Name
Owned For
Owner Type
Purchase Details
Closed on
Jul 29, 2021
Sold by
Clarey Jamie J
Bought by
Madson Laura M
Current Estimated Value
Home Financials for this Owner
Home Financials are based on the most recent Mortgage that was taken out on this home.
Original Mortgage
$223,003
Outstanding Balance
$202,870
Interest Rate
2.93%
Mortgage Type
New Conventional
Estimated Equity
$89,505
Purchase Details
Closed on
May 25, 2017
Sold by
Smart Gary M and Denne Sherii M
Bought by
Clarey Jamie J
Home Financials for this Owner
Home Financials are based on the most recent Mortgage that was taken out on this home.
Original Mortgage
$190,486
Interest Rate
4.08%
Mortgage Type
FHA
Purchase Details
Closed on
Nov 14, 2014
Sold by
Smart Gary M
Bought by
Smart Gary M and Denne Sherri M
Create a Home Valuation Report for This Property
The Home Valuation Report is an in-depth analysis detailing your home's value as well as a comparison with similar homes in the area
Home Values in the Area
Average Home Value in this Area
Purchase History
| Date | Buyer | Sale Price | Title Company |
|---|---|---|---|
| Madson Laura M | $229,900 | Fm Title | |
| Clarey Jamie J | $194,000 | Title Co | |
| Smart Gary M | $76,720 | None Available |
Source: Public Records
Mortgage History
| Date | Status | Borrower | Loan Amount |
|---|---|---|---|
| Open | Madson Laura M | $223,003 | |
| Previous Owner | Clarey Jamie J | $190,486 |
Source: Public Records
Tax History Compared to Growth
Tax History
| Year | Tax Paid | Tax Assessment Tax Assessment Total Assessment is a certain percentage of the fair market value that is determined by local assessors to be the total taxable value of land and additions on the property. | Land | Improvement |
|---|---|---|---|---|
| 2024 | $3,710 | $127,550 | $23,250 | $104,300 |
| 2023 | $3,678 | $126,450 | $23,250 | $103,200 |
| 2022 | $3,532 | $115,850 | $23,250 | $92,600 |
| 2021 | $3,331 | $104,900 | $18,300 | $86,600 |
| 2020 | $3,139 | $100,850 | $18,300 | $82,550 |
| 2019 | $3,019 | $96,350 | $18,300 | $78,050 |
| 2018 | $2,902 | $96,350 | $18,300 | $78,050 |
| 2017 | $2,643 | $92,550 | $18,300 | $74,250 |
| 2016 | $2,237 | $88,900 | $18,300 | $70,600 |
| 2015 | $2,136 | $77,800 | $9,250 | $68,550 |
| 2014 | $2,091 | $72,700 | $9,250 | $63,450 |
| 2013 | $2,019 | $70,850 | $9,250 | $61,600 |
Source: Public Records
Map
Nearby Homes
- 410 Westwind Dr
- 1034 4th Ave W
- 410 Westwynd Dr
- 1026 4th Ave W
- 414 Westwynd Dr
- 1022 4th Ave W
- 422 Westwynd Dr
- 427 11th St W
- 426 Westwynd Dr
- 1014 4th Ave W
- 1114 5th Ave W
- 1010 4th Ave W
- 1019 4th Ave W
- 435 11th St W
- 438 Westwynd Dr
- 1122 5th Ave W
- 998 4th Ave W
- 1015 4th Ave W
- 1130 5th Ave W
- 446 Westwind Dr