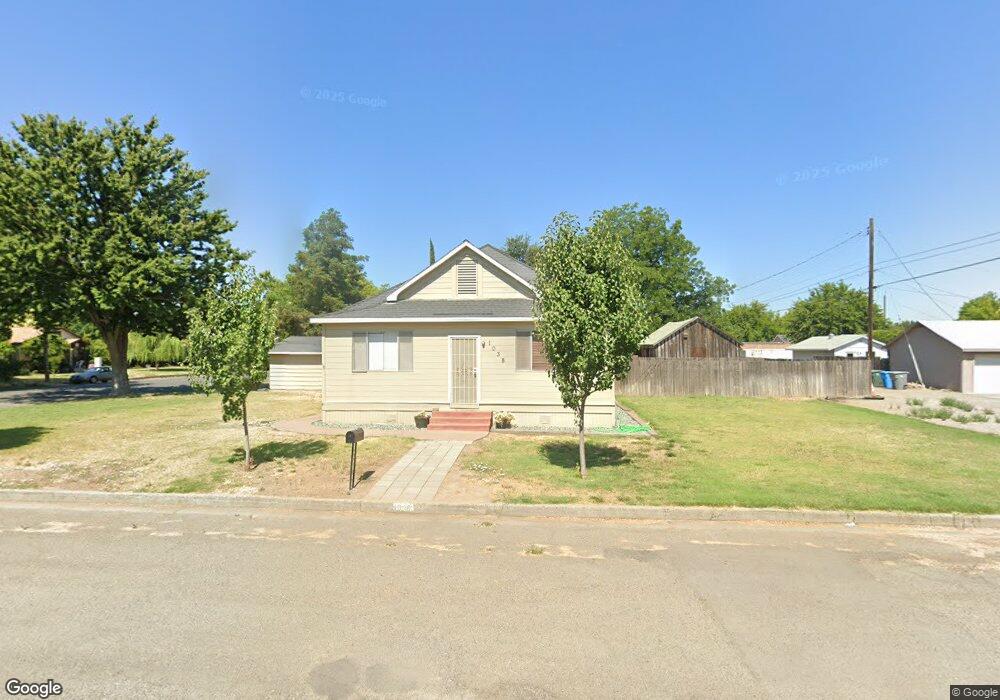
1038 4th St Colusa, CA 95932
Estimated Value: $263,000 - $321,000
3
Beds
1
Bath
1,315
Sq Ft
$220/Sq Ft
Est. Value
About This Home
This home is located at 1038 4th St, Colusa, CA 95932 and is currently estimated at $289,691, approximately $220 per square foot. 1038 4th St is a home located in Colusa County with nearby schools including James M. Burchfield Primary School, George T. Egling Middle School, and Colusa High School.
Ownership History
Date
Name
Owned For
Owner Type
Purchase Details
Closed on
Feb 22, 2022
Sold by
Brooke Reading and Joseph R Candito Living Trust
Bought by
Reading Shannon
Current Estimated Value
Purchase Details
Closed on
Oct 6, 2011
Sold by
Candito Joseph R
Bought by
Candito Joseph R and Joseph R Candito Living Trust
Purchase Details
Closed on
Aug 25, 2010
Sold by
Candito Joseph Ronald
Bought by
Candito Joseph Ronald and Reading Shannon Brooke
Create a Home Valuation Report for This Property
The Home Valuation Report is an in-depth analysis detailing your home's value as well as a comparison with similar homes in the area
Home Values in the Area
Average Home Value in this Area
Purchase History
We collect this data history from publicly available records. To have your information removed, we recommend requesting removal directly through your county’s website.
| Date | Buyer | Sale Price | Title Company |
|---|---|---|---|
| Reading Shannon | -- | None Listed On Document | |
| Candito Joseph R | -- | None Available | |
| Candito Joseph Ronald | -- | None Available |
Source: Public Records
Tax History
| Year | Tax Paid | Tax Assessment Tax Assessment Total Assessment is a certain percentage of the fair market value that is determined by local assessors to be the total taxable value of land and additions on the property. | Land | Improvement |
|---|---|---|---|---|
| 2025 | $889 | $68,759 | $22,764 | $45,995 |
| 2024 | $889 | $67,412 | $22,318 | $45,094 |
| 2023 | $839 | $66,091 | $21,881 | $44,210 |
| 2022 | $833 | $64,796 | $21,452 | $43,344 |
| 2021 | $797 | $63,527 | $21,032 | $42,495 |
| 2020 | $1,017 | $62,877 | $20,817 | $42,060 |
| 2019 | $778 | $61,645 | $20,409 | $41,236 |
| 2018 | $771 | $60,437 | $20,009 | $40,428 |
| 2017 | $768 | $59,253 | $19,617 | $39,636 |
| 2016 | $749 | $58,092 | $19,233 | $38,859 |
| 2015 | $736 | $57,221 | $18,945 | $38,276 |
| 2014 | $705 | $56,101 | $18,574 | $37,527 |
Source: Public Records
Map
Nearby Homes
- 7300 Farinon Rd
- 0 E Carson St Unit 225122408
- 303 Louis Ln
- 130 Fremont St
- 546 Parkhill St
- 724 Webster St
- 738 Webster St
- 547 Clay St
- 1425 5th St
- 528 Clay St
- 35 Parkhill St
- 853 11th St
- 243 7th St
- 1732 Wescott Rd
- 745 Main St
- 80 2nd St
- 1801 Highway 20 Unit 2
- 115 Country Club Dr
- 212 Country Club Dr
- 434 Kittyhawk Rd
Your Personal Tour Guide
Ask me questions while you tour the home.