Estimated Value: $360,000 - $408,000
3
Beds
2
Baths
1,296
Sq Ft
$294/Sq Ft
Est. Value
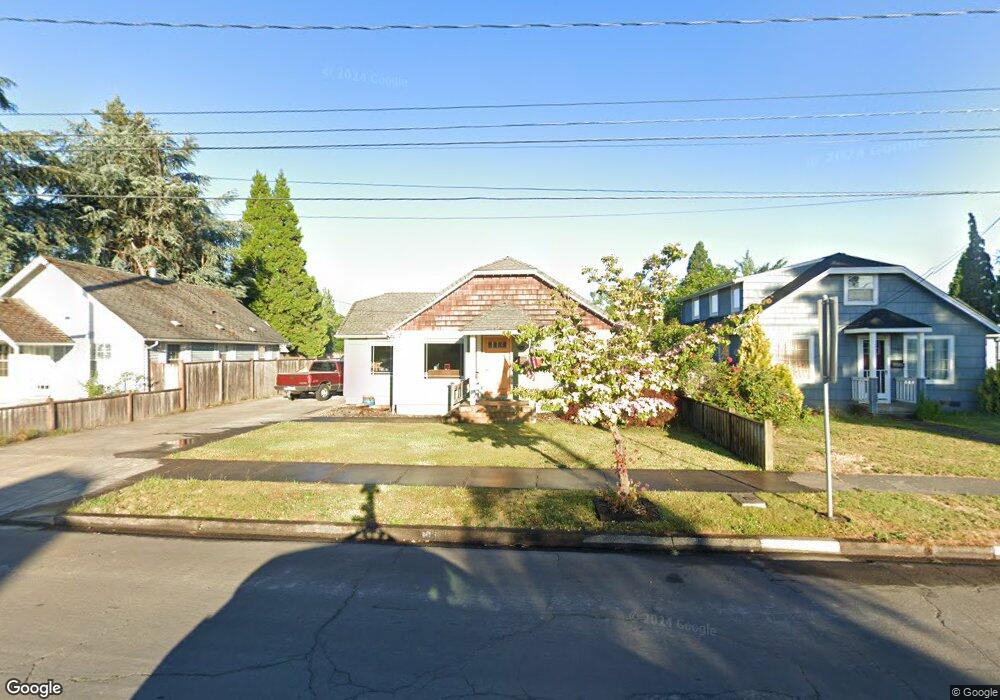
About This Home
This home is located at 1038 7th St, Springfield, OR 97477 and is currently estimated at $381,300, approximately $294 per square foot. 1038 7th St is a home located in Lane County with nearby schools including Two Rivers Dos Rios Elementary School, Hamlin Middle School, and Springfield High School.
Ownership History
Date
Name
Owned For
Owner Type
Purchase Details
Closed on
Mar 22, 1999
Sold by
Engeman Mabel A
Bought by
Land Michael R
Current Estimated Value
Home Financials for this Owner
Home Financials are based on the most recent Mortgage that was taken out on this home.
Original Mortgage
$87,200
Interest Rate
6.73%
Create a Home Valuation Report for This Property
The Home Valuation Report is an in-depth analysis detailing your home's value as well as a comparison with similar homes in the area
Home Values in the Area
Average Home Value in this Area
Purchase History
| Date | Buyer | Sale Price | Title Company |
|---|---|---|---|
| Land Michael R | $89,900 | Evergreen Land Title Company |
Source: Public Records
Mortgage History
| Date | Status | Borrower | Loan Amount |
|---|---|---|---|
| Previous Owner | Land Michael R | $87,200 |
Source: Public Records
Tax History
| Year | Tax Paid | Tax Assessment Tax Assessment Total Assessment is a certain percentage of the fair market value that is determined by local assessors to be the total taxable value of land and additions on the property. | Land | Improvement |
|---|---|---|---|---|
| 2025 | $3,476 | $189,542 | -- | -- |
| 2024 | $3,419 | $184,022 | -- | -- |
| 2023 | $3,419 | $178,663 | $0 | $0 |
| 2022 | $3,167 | $173,460 | $0 | $0 |
| 2021 | $3,110 | $168,408 | $0 | $0 |
| 2020 | $3,019 | $163,503 | $0 | $0 |
| 2019 | $2,929 | $158,741 | $0 | $0 |
| 2018 | $2,761 | $149,629 | $0 | $0 |
| 2017 | $2,655 | $149,629 | $0 | $0 |
| 2016 | $2,599 | $145,271 | $0 | $0 |
| 2015 | $2,525 | $141,040 | $0 | $0 |
| 2014 | $2,487 | $136,932 | $0 | $0 |
Source: Public Records
Map
Nearby Homes
Your Personal Tour Guide
Ask me questions while you tour the home.