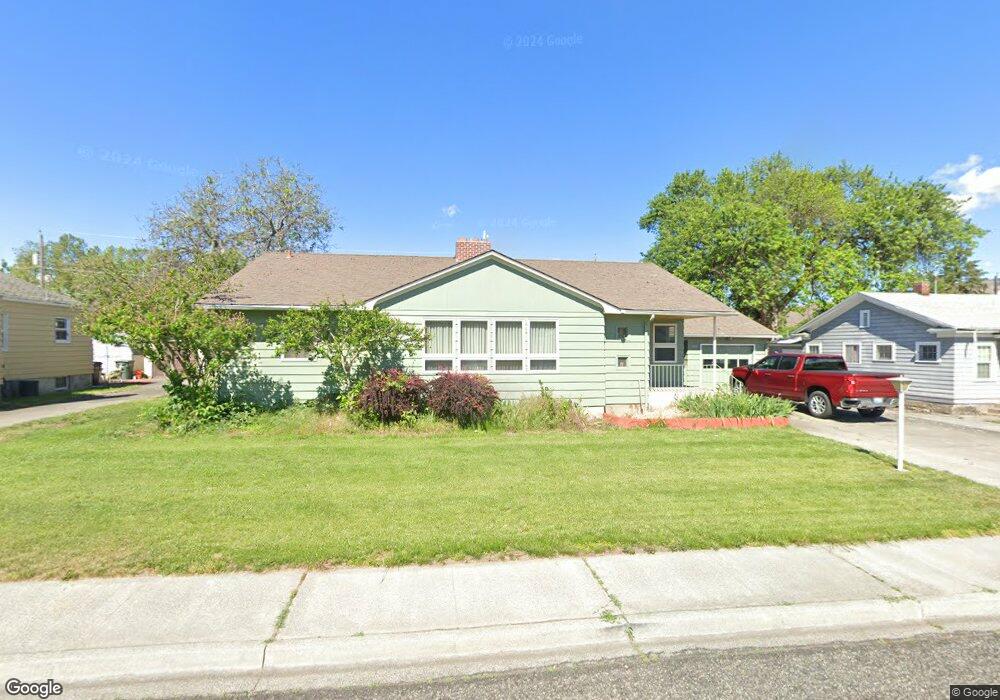
1038 9th St Clarkston, WA 99403
Estimated Value: $163,368 - $412,000
Studio
--
Bath
1,474
Sq Ft
$199/Sq Ft
Est. Value
About This Home
This home is located at 1038 9th St, Clarkston, WA 99403 and is currently estimated at $292,842, approximately $198 per square foot. 1038 9th St is a home located in Asotin County with nearby schools including Parkway Elementary School, Lincoln Middle School, and Charles Francis Adams High School.
Ownership History
Date
Name
Owned For
Owner Type
Purchase Details
Closed on
Jul 28, 2022
Sold by
Adrian Kiesser
Bought by
Williams Bruce
Current Estimated Value
Purchase Details
Closed on
Oct 20, 2020
Sold by
Johnson Britta E
Bought by
Kiesser Adrian
Purchase Details
Closed on
Nov 7, 2019
Sold by
Knoll Nancy G
Bought by
Johnson Britta E
Create a Home Valuation Report for This Property
The Home Valuation Report is an in-depth analysis detailing your home's value as well as a comparison with similar homes in the area
Home Values in the Area
Average Home Value in this Area
Purchase History
| Date | Buyer | Sale Price | Title Company |
|---|---|---|---|
| Williams Bruce | $130,000 | Alliance Title | |
| Kiesser Adrian | $111,000 | Alliance Title Clarkston | |
| Johnson Britta E | $94,501 | Alliance Title & Escrow |
Source: Public Records
Tax History
| Year | Tax Paid | Tax Assessment Tax Assessment Total Assessment is a certain percentage of the fair market value that is determined by local assessors to be the total taxable value of land and additions on the property. | Land | Improvement |
|---|---|---|---|---|
| 2025 | $2,860 | $245,900 | $30,000 | $215,900 |
| 2024 | $5,308 | $509,200 | $126,600 | $382,600 |
| 2023 | $2,860 | $245,900 | $30,000 | $215,900 |
| 2022 | $2,824 | $245,900 | $30,000 | $215,900 |
| 2021 | $2,281 | $245,900 | $30,000 | $215,900 |
| 2020 | $2,037 | $180,900 | $37,000 | $143,900 |
| 2019 | $1,969 | $180,900 | $37,000 | $143,900 |
| 2018 | $2,381 | $180,900 | $37,000 | $143,900 |
| 2017 | $2,231 | $180,900 | $37,000 | $143,900 |
| 2016 | $2,231 | $180,900 | $37,000 | $143,900 |
| 2015 | $221 | $182,400 | $37,000 | $145,400 |
| 2013 | $2,318 | $178,200 | $37,000 | $141,200 |
Source: Public Records
Map
Nearby Homes