1038 Canton Cir Claremont, CA 91711
Northeast Claremont NeighborhoodEstimated Value: $2,338,000 - $2,944,000
About This Home
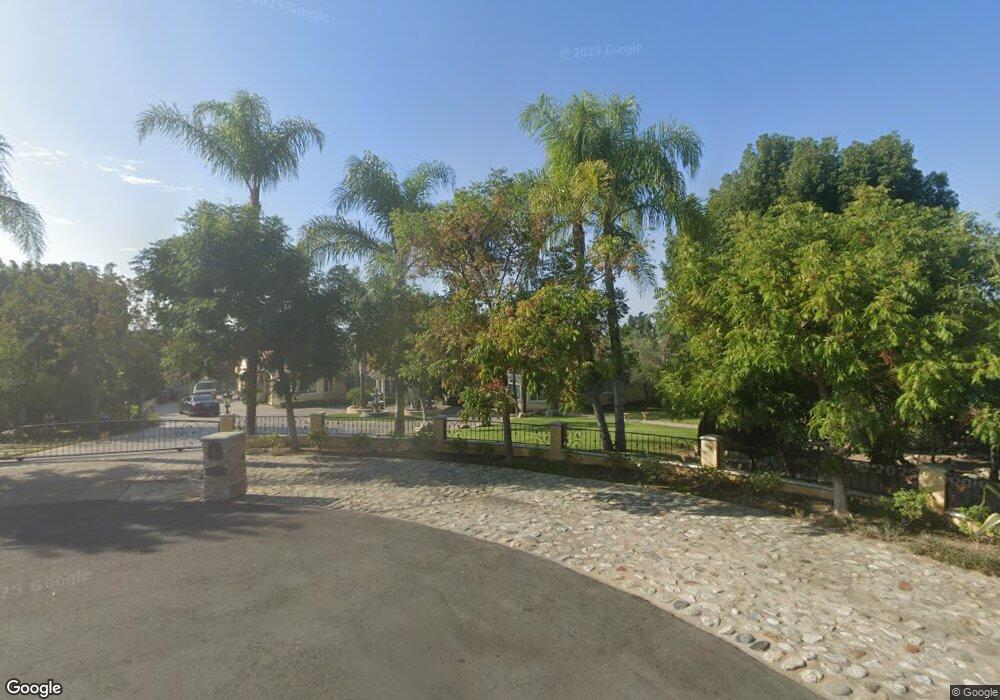
This home is located at 1038 Canton Cir, Claremont, CA 91711 and is currently estimated at $2,581,594, approximately $447 per square foot. 1038 Canton Cir is a home located in Los Angeles County with nearby schools including Chaparral Elementary School, El Roble Intermediate School, and Claremont High School.
Ownership History
We collect this data history from publicly available records. To have your information removed, we recommend requesting removal directly through your county’s website.
Purchase Details
Home Financials for this Owner
Home Financials are based on the most recent Mortgage that was taken out on this home.Purchase Details
Purchase Details
Purchase Details
Purchase Details
Home Financials for this Owner
Home Financials are based on the most recent Mortgage that was taken out on this home.Purchase Details
Home Financials for this Owner
Home Financials are based on the most recent Mortgage that was taken out on this home.Purchase Details
Home Financials for this Owner
Home Financials are based on the most recent Mortgage that was taken out on this home.Home Values in the Area
Average Home Value in this Area
Purchase History
We collect this data history from publicly available records. To have your information removed, we recommend requesting removal directly through your county’s website.
| Date | Buyer | Sale Price | Title Company |
|---|---|---|---|
| -- | First American Title Company | ||
| -- | None Available | ||
| -- | None Available | ||
| -- | None Available | ||
| -- | -- | ||
| $805,000 | Fidelity National Title Ins | ||
| $797,000 | Fidelity National Title Co |
Mortgage History
We collect this data history from publicly available records. To have your information removed, we recommend requesting removal directly through your county’s website.
| Date | Status | Borrower | Loan Amount |
|---|---|---|---|
| Closed | $1,812,000 | ||
| Closed | $350,000 | ||
| Closed | $1,500,000 | ||
| Closed | $298,250 | ||
| Closed | $250,000 | ||
| Closed | $1,000,000 | ||
| Closed | $500,000 | ||
| Closed | $250,000 | ||
| Closed | $100,000 | ||
| Closed | $735,000 | ||
| Closed | $725,000 | ||
| Closed | $650,000 | ||
| Closed | $644,000 |
Tax History
We collect this data history from publicly available records. To have your information removed, we recommend requesting removal directly through your county’s website.
| Year | Tax Paid | Tax Assessment Tax Assessment Total Assessment is a certain percentage of the fair market value that is determined by local assessors to be the total taxable value of land and additions on the property. | Land | Improvement |
|---|---|---|---|---|
| 2025 | $22,953 | $1,840,478 | $1,130,690 | $709,788 |
| 2024 | $22,078 | $1,804,391 | $1,108,520 | $695,871 |
| 2023 | $21,522 | $1,769,012 | $1,086,785 | $682,227 |
| 2022 | $21,192 | $1,734,326 | $1,065,476 | $668,850 |
| 2021 | $20,875 | $1,700,321 | $1,044,585 | $655,736 |
| 2020 | $20,309 | $1,682,888 | $1,033,875 | $649,013 |
| 2019 | $19,906 | $1,649,891 | $1,013,603 | $636,288 |
| 2018 | $19,215 | $1,617,541 | $993,729 | $623,812 |
| 2016 | $17,879 | $1,554,733 | $955,143 | $599,590 |
| 2015 | $17,620 | $1,531,380 | $940,796 | $590,584 |
| 2014 | $17,473 | $1,501,384 | $922,368 | $579,016 |
Map
- 3624 Hollins Ave
- 3742 Hollins Ave
- 1008 Amarillo Dr
- 1008 Alamosa Dr
- 918 Appalachian
- 1746 Franklin Tree Place
- 1646 Coral Bells Place
- 1592 Evergreen Dr
- 1584 W Buffington St
- 4394 Hiwassee
- 1703 Almond Tree Place
- 1633 Topeka Place
- 922 E Baseline Rd
- 4463 Cardinal Cushing
- 862 E Baseline Rd
- 940 Heritage Ct
- 1836 Plan Tree Dr
- 1604 Ruedy Place
- 532 Chouinard Cir
- 1757 W Andes Dr
- 1059 Pomello Dr
- 1044 Canton Cir
- 1053 Pomello Dr
- 1037 Canton Cir
- 1043 Canton Cir
- 1060 Pomello Dr
- 1070 Pomello Dr
- 1024 Belleville Ct
- 1046 Pomello Dr
- 1036 Pomello Dr
- 3714 Hollins Ave
- 3708 Hollins Ave
- 3729 Hollins Ave
- 3632 Moraine Ave
- 3750 Padua Ave
- 1018 Belleville Ct
- 3626 Moraine Ave
- 3720 Hollins Ave
- 3632 Hollins Ave
- 1024 Pomello Dr
Ask me questions while you tour the home.