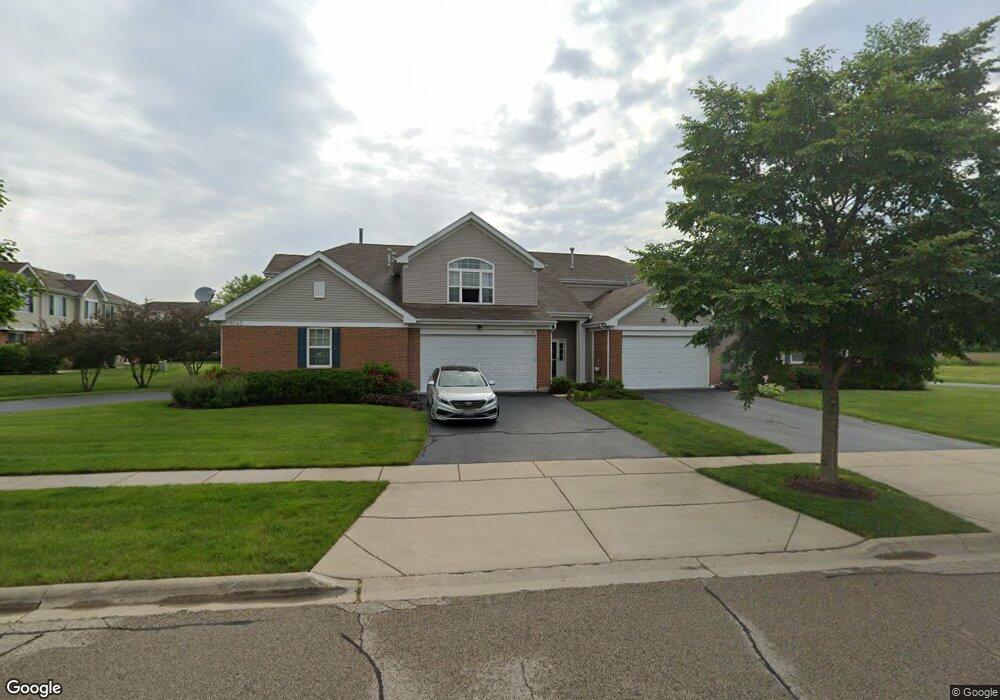
1038 Carrick Ln McHenry, IL 60050
Estimated Value: $270,000 - $314,000
Studio
2
Baths
1,818
Sq Ft
$157/Sq Ft
Est. Value
About This Home
This home is located at 1038 Carrick Ln, McHenry, IL 60050 and is currently estimated at $285,896, approximately $157 per square foot. 1038 Carrick Ln is a home located in McHenry County with nearby schools including Riverwood Elementary School, Parkland School, and Montini Catholic School.
Ownership History
Date
Name
Owned For
Owner Type
Purchase Details
Closed on
Apr 12, 2018
Sold by
Bourne Cheri L
Bought by
Innes James L and Innes Anita G
Current Estimated Value
Home Financials for this Owner
Home Financials are based on the most recent Mortgage that was taken out on this home.
Original Mortgage
$123,750
Outstanding Balance
$106,448
Interest Rate
4.45%
Mortgage Type
New Conventional
Estimated Equity
$179,448
Purchase Details
Closed on
Jan 21, 2011
Sold by
Cyburt Margaret F
Bought by
Cyburt Margaret F and Bourne Cheri L
Purchase Details
Closed on
Feb 29, 2008
Sold by
Kimball Hill Homes Illinois Llc
Bought by
Cyburt Margaret F
Home Financials for this Owner
Home Financials are based on the most recent Mortgage that was taken out on this home.
Original Mortgage
$144,106
Interest Rate
5.51%
Mortgage Type
Purchase Money Mortgage
Create a Home Valuation Report for This Property
The Home Valuation Report is an in-depth analysis detailing your home's value as well as a comparison with similar homes in the area
Home Values in the Area
Average Home Value in this Area
Purchase History
| Date | Buyer | Sale Price | Title Company |
|---|---|---|---|
| Innes James L | $166,667 | Fidelity National Title | |
| Cyburt Margaret F | -- | Accommodation | |
| Cyburt Margaret F | $191,702 | Stewart Title Company |
Source: Public Records
Mortgage History
| Date | Status | Borrower | Loan Amount |
|---|---|---|---|
| Open | Innes James L | $123,750 | |
| Previous Owner | Cyburt Margaret F | $144,106 |
Source: Public Records
Tax History
| Year | Tax Paid | Tax Assessment Tax Assessment Total Assessment is a certain percentage of the fair market value that is determined by local assessors to be the total taxable value of land and additions on the property. | Land | Improvement |
|---|---|---|---|---|
| 2024 | $4,853 | $73,368 | $7,347 | $66,021 |
| 2023 | $4,594 | $65,730 | $6,582 | $59,148 |
| 2022 | $4,748 | $60,979 | $6,106 | $54,873 |
| 2021 | $4,480 | $56,788 | $5,686 | $51,102 |
| 2020 | $4,050 | $51,903 | $9,636 | $42,267 |
| 2019 | $3,948 | $49,286 | $9,150 | $40,136 |
| 2018 | $4,305 | $43,568 | $8,735 | $34,833 |
| 2017 | $3,528 | $40,890 | $8,198 | $32,692 |
| 2016 | $3,023 | $38,215 | $7,662 | $30,553 |
| 2013 | -- | $34,534 | $7,543 | $26,991 |
Source: Public Records
Map
Nearby Homes
- 1420 Draper Rd
- 1053 Carrick Ln Unit 1053
- 1358 Draper Rd Unit 254
- 1246 Draper Rd
- 1213 Draper Rd
- 1241 Draper Rd
- 1001 Draper Rd
- 1029 Draper Rd
- 1606 Tecumseh Dr
- 6522 Sycamore Ct
- 6503 Tustamena Trail
- 606 Waters Edge Dr Unit A
- 5837 Fieldstone Trail Unit 5837
- 516 N Thornwood Dr Unit 516
- 5101 W Elm St
- 1702 Parklane Ave
- 1013 Hampton Ct
- 509 Silbury Ct
- 5108 Home Ave Unit 3
- 5213 W Greenbrier Dr
- 1038 Carrick Ln Unit 22-2
- 1038 Carrick Ln Unit 47-2
- 1030 Carrick Ln
- 1034 Carrick Ln
- 1042 Carrick Ln Unit 221
- 1042 Carrick Ln Unit 42
- 1034 Carrick Ln Unit 47-3
- 1204 Draper Rd
- 1214 Draper Rd
- 1200 Draper Rd
- 1428 Draper Rd
- 1424 Draper Rd
- 1420 Draper Rd Unit 48-2
- 1424 Draper Rd Unit 48-3
- 1428 Draper Rd Unit 48-4
- 1416 Draper Rd
- 1416 Draper Rd Unit 23-1
- 1416 Draper Rd Unit 48-1
- 1208 Draper Rd
- 1029 Carrick Ln
Your Personal Tour Guide
Ask me questions while you tour the home.