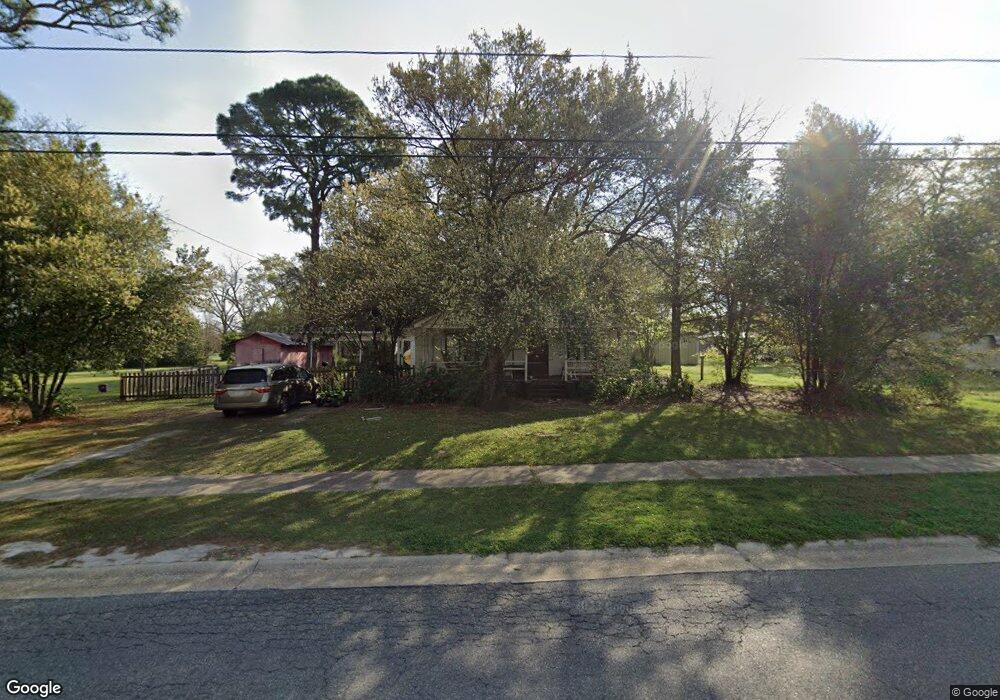
1038 Cedar St Barwick, GA 31720
Estimated Value: $95,000 - $200,000
--
Bed
--
Bath
1,664
Sq Ft
$91/Sq Ft
Est. Value
About This Home
This home is located at 1038 Cedar St, Barwick, GA 31720 and is currently estimated at $151,583, approximately $91 per square foot. 1038 Cedar St is a home with nearby schools including Hand in Hand Primary School, Garrison-Pilcher Elementary School, and Cross Creek Elementary School.
Ownership History
Date
Name
Owned For
Owner Type
Purchase Details
Closed on
Jun 20, 2014
Sold by
Parker Gregory Todd
Bought by
Poppell Jeremy Ryan and Poppell Jenna
Current Estimated Value
Home Financials for this Owner
Home Financials are based on the most recent Mortgage that was taken out on this home.
Original Mortgage
$74,623
Outstanding Balance
$56,739
Interest Rate
4.19%
Mortgage Type
FHA
Estimated Equity
$94,844
Purchase Details
Closed on
Jun 5, 2007
Sold by
Georgia Housing & Financ
Bought by
Sec Of Housing & Urban
Purchase Details
Closed on
Jun 30, 2005
Sold by
Clouse Valorie L
Bought by
Lamb Debra L
Purchase Details
Closed on
May 6, 2003
Sold by
Moye David C
Bought by
Clouse Valorie L
Purchase Details
Closed on
May 2, 1991
Bought by
Moye David C
Create a Home Valuation Report for This Property
The Home Valuation Report is an in-depth analysis detailing your home's value as well as a comparison with similar homes in the area
Home Values in the Area
Average Home Value in this Area
Purchase History
| Date | Buyer | Sale Price | Title Company |
|---|---|---|---|
| Poppell Jeremy Ryan | $76,000 | -- | |
| Sec Of Housing & Urban | -- | -- | |
| Georgia Housing & Finance Au | $79,878 | -- | |
| Lamb Debra L | $80,000 | -- | |
| Clouse Valorie L | $52,000 | -- | |
| Moye David C | -- | -- |
Source: Public Records
Mortgage History
| Date | Status | Borrower | Loan Amount |
|---|---|---|---|
| Open | Poppell Jeremy Ryan | $74,623 |
Source: Public Records
Tax History Compared to Growth
Tax History
| Year | Tax Paid | Tax Assessment Tax Assessment Total Assessment is a certain percentage of the fair market value that is determined by local assessors to be the total taxable value of land and additions on the property. | Land | Improvement |
|---|---|---|---|---|
| 2024 | $1,642 | $51,665 | $5,462 | $46,203 |
| 2023 | $1,448 | $48,880 | $5,462 | $43,418 |
| 2022 | $989 | $42,912 | $4,552 | $38,360 |
| 2021 | $934 | $37,090 | $4,552 | $32,538 |
| 2020 | $923 | $35,870 | $4,552 | $31,318 |
| 2019 | $928 | $35,870 | $4,552 | $31,318 |
| 2018 | $928 | $35,590 | $4,552 | $31,038 |
| 2017 | $935 | $35,340 | $4,051 | $31,289 |
| 2016 | $921 | $34,743 | $4,051 | $30,692 |
| 2015 | $807 | $35,634 | $3,778 | $31,856 |
| 2014 | $987 | $34,868 | $3,778 | $31,090 |
| 2013 | -- | $34,868 | $3,778 | $31,090 |
Source: Public Records
Map
Nearby Homes
- 1038 Cedar St
- 1017-BA E Main St
- 1047 Cedar St
- 1061-BA E Main St
- 1031 Cedar St
- 1011 Cedar St
- 1072 E Gin St
- 1011 Cedar St
- 144 Main St
- 2017 Cedar St
- 2017 S Cedar St
- 1040-BA W Main St
- 1012 E Main St
- 1010 S Cedar St
- 590 Hutchinson Rd
- 1040 Main St
- 1012 Main St
- 1072-BA W Main St
- 1035-BA W Main St
- 1035 Main St