Estimated Value: $397,000 - $438,000
4
Beds
3
Baths
2,300
Sq Ft
$180/Sq Ft
Est. Value
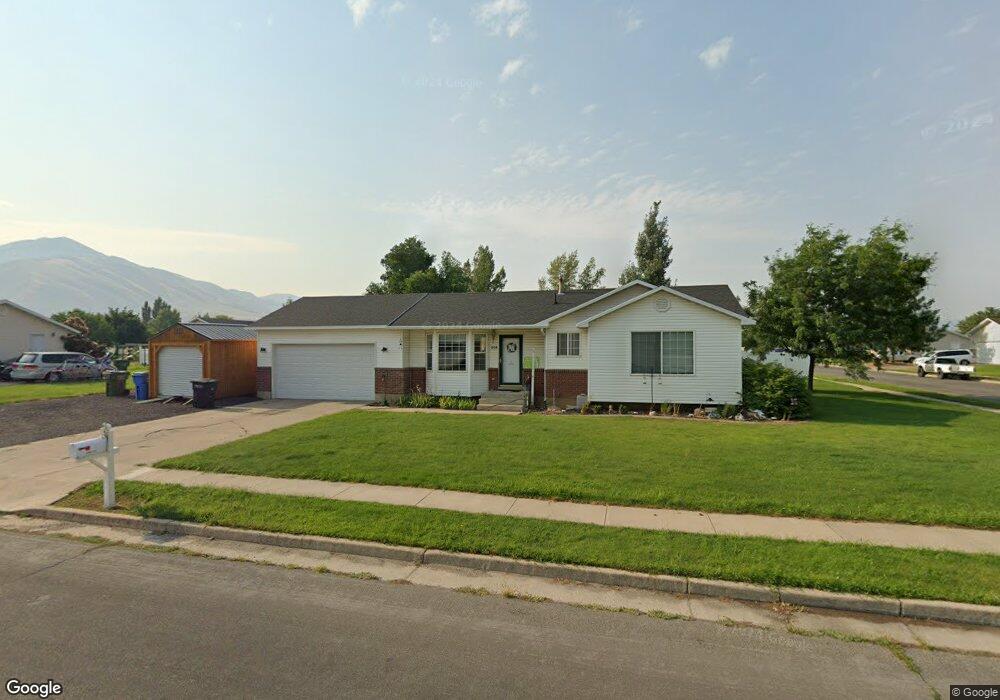
About This Home
This home is located at 1038 E 30 S, Hyrum, UT 84319 and is currently estimated at $413,896, approximately $179 per square foot. 1038 E 30 S is a home located in Cache County with nearby schools including Canyon School, South Cache Middle School, and Mountain Crest High School.
Ownership History
Date
Name
Owned For
Owner Type
Purchase Details
Closed on
Sep 29, 2011
Sold by
Hymas Steve M and Hymas Kelly R
Bought by
Mayers Joseph and Mayers Traci
Current Estimated Value
Home Financials for this Owner
Home Financials are based on the most recent Mortgage that was taken out on this home.
Original Mortgage
$160,518
Outstanding Balance
$108,622
Interest Rate
4.09%
Mortgage Type
New Conventional
Estimated Equity
$305,274
Purchase Details
Closed on
Aug 25, 2005
Sold by
Wallace Isaac and Wallace Lisa
Bought by
Hymas Steve M and Hymas Kelly R
Home Financials for this Owner
Home Financials are based on the most recent Mortgage that was taken out on this home.
Original Mortgage
$126,217
Interest Rate
5.61%
Mortgage Type
FHA
Purchase Details
Closed on
Oct 4, 2002
Sold by
Lott Bret T and Lott Denise R
Bought by
Juniper Services Inc
Create a Home Valuation Report for This Property
The Home Valuation Report is an in-depth analysis detailing your home's value as well as a comparison with similar homes in the area
Home Values in the Area
Average Home Value in this Area
Purchase History
| Date | Buyer | Sale Price | Title Company |
|---|---|---|---|
| Mayers Joseph | -- | American Secure Title Logan | |
| Hymas Steve M | -- | American Secure Title | |
| Juniper Services Inc | $103,312 | -- |
Source: Public Records
Mortgage History
| Date | Status | Borrower | Loan Amount |
|---|---|---|---|
| Open | Mayers Joseph | $160,518 | |
| Previous Owner | Hymas Steve M | $126,217 |
Source: Public Records
Tax History
| Year | Tax Paid | Tax Assessment Tax Assessment Total Assessment is a certain percentage of the fair market value that is determined by local assessors to be the total taxable value of land and additions on the property. | Land | Improvement |
|---|---|---|---|---|
| 2025 | $1,504 | $215,895 | $0 | $0 |
| 2024 | $1,627 | $218,175 | $0 | $0 |
| 2023 | $1,474 | $189,035 | $0 | $0 |
| 2022 | $1,539 | $189,035 | $0 | $0 |
| 2021 | $1,521 | $287,965 | $65,050 | $222,915 |
| 2020 | $1,313 | $233,250 | $65,050 | $168,200 |
| 2019 | $1,246 | $208,200 | $40,000 | $168,200 |
| 2018 | $1,066 | $172,110 | $40,000 | $132,110 |
| 2017 | $1,051 | $88,055 | $0 | $0 |
| 2016 | $1,074 | $88,055 | $0 | $0 |
| 2015 | $934 | $76,355 | $0 | $0 |
| 2014 | $913 | $76,355 | $0 | $0 |
| 2013 | -- | $76,355 | $0 | $0 |
Source: Public Records
Map
Nearby Homes
Your Personal Tour Guide
Ask me questions while you tour the home.