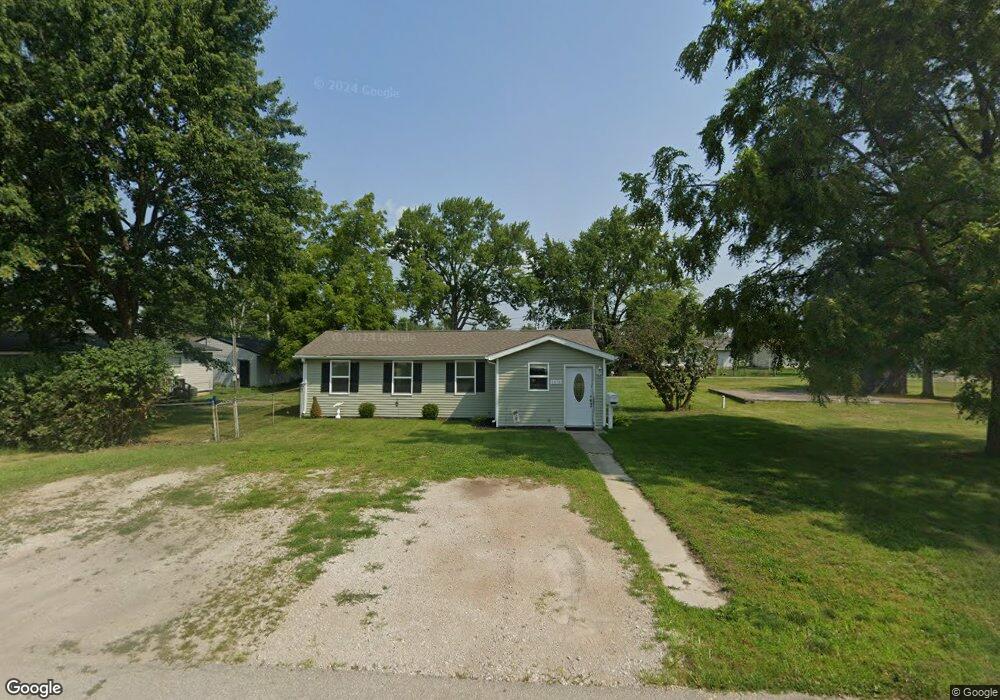
1038 Krick St Decatur, IN 46733
Estimated Value: $112,000 - $237,000
3
Beds
2
Baths
1,532
Sq Ft
$107/Sq Ft
Est. Value
About This Home
This home is located at 1038 Krick St, Decatur, IN 46733 and is currently estimated at $164,035, approximately $107 per square foot. 1038 Krick St is a home located in Adams County with nearby schools including Southeast Elementary School, Bellmont Elementary School, and Bellmont Middle School.
Ownership History
Date
Name
Owned For
Owner Type
Purchase Details
Closed on
Dec 12, 2019
Sold by
Rns Properties Llc
Bought by
Mann Joshua A
Current Estimated Value
Home Financials for this Owner
Home Financials are based on the most recent Mortgage that was taken out on this home.
Original Mortgage
$95,920
Outstanding Balance
$84,733
Interest Rate
3.7%
Mortgage Type
New Conventional
Estimated Equity
$79,302
Purchase Details
Closed on
Nov 9, 2018
Sold by
Raz Llc
Bought by
Rns Properties Llc
Purchase Details
Closed on
Mar 22, 2018
Sold by
Bobeck Peter
Bought by
Raz Llc
Purchase Details
Closed on
May 20, 2016
Sold by
Moore Olga L
Bought by
Raz Llc
Purchase Details
Closed on
May 22, 2008
Sold by
Moore Olga L
Bought by
Moore Olga L
Create a Home Valuation Report for This Property
The Home Valuation Report is an in-depth analysis detailing your home's value as well as a comparison with similar homes in the area
Home Values in the Area
Average Home Value in this Area
Purchase History
| Date | Buyer | Sale Price | Title Company |
|---|---|---|---|
| Mann Joshua A | -- | None Available | |
| Rns Properties Llc | -- | None Available | |
| Rns Properties Llc | -- | -- | |
| Raz Llc | -- | -- | |
| Raz Llc | -- | Fidelity National Title | |
| Moore Olga L | -- | -- |
Source: Public Records
Mortgage History
| Date | Status | Borrower | Loan Amount |
|---|---|---|---|
| Open | Mann Joshua A | $95,920 |
Source: Public Records
Tax History Compared to Growth
Tax History
| Year | Tax Paid | Tax Assessment Tax Assessment Total Assessment is a certain percentage of the fair market value that is determined by local assessors to be the total taxable value of land and additions on the property. | Land | Improvement |
|---|---|---|---|---|
| 2024 | $592 | $82,500 | $9,800 | $72,700 |
| 2023 | $550 | $80,300 | $9,800 | $70,500 |
| 2022 | $523 | $81,800 | $9,800 | $72,000 |
| 2021 | $431 | $75,100 | $9,500 | $65,600 |
| 2020 | $397 | $74,000 | $9,500 | $64,500 |
| 2019 | $360 | $70,700 | $9,500 | $61,200 |
| 2018 | $486 | $24,300 | $9,500 | $14,800 |
| 2017 | $478 | $23,900 | $9,300 | $14,600 |
| 2016 | $1,188 | $60,900 | $9,300 | $51,600 |
| 2014 | $1,208 | $60,400 | $9,300 | $51,100 |
| 2013 | $1,220 | $61,000 | $9,300 | $51,700 |
Source: Public Records
Map
Nearby Homes