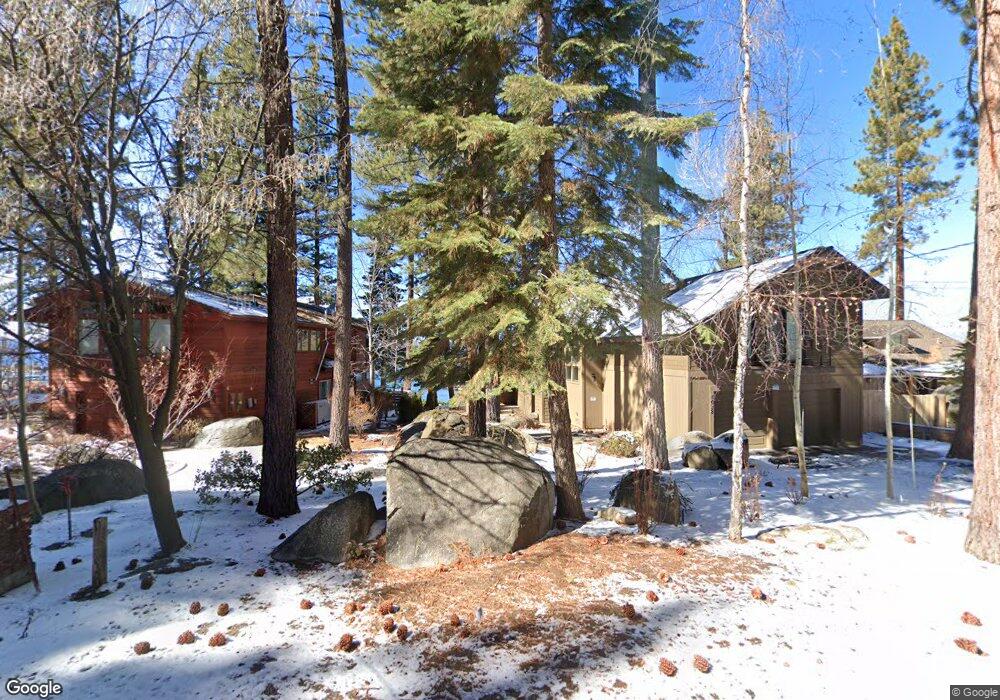
1038 Skyland Dr Zephyr Cove, NV 89448
Estimated Value: $2,768,000 - $5,556,757
3
Beds
3
Baths
2,253
Sq Ft
$1,690/Sq Ft
Est. Value
About This Home
This home is located at 1038 Skyland Dr, Zephyr Cove, NV 89448 and is currently estimated at $3,806,939, approximately $1,689 per square foot. 1038 Skyland Dr is a home located in Douglas County with nearby schools including Zephyr Cove Elementary School, George Whittell High School, and Douglas County High School.
Ownership History
Date
Name
Owned For
Owner Type
Purchase Details
Closed on
Dec 18, 2012
Sold by
Tahoe Lakeside 74 Llc
Bought by
Quiet Cove 12 Llc
Current Estimated Value
Purchase Details
Closed on
Nov 28, 2012
Sold by
Luckey Thomas A and Luckey Cathie A
Bought by
Quiet Cove 12 Llc
Purchase Details
Closed on
Aug 1, 2012
Sold by
Luckey Thomas A
Bought by
Luckey Thomas A
Purchase Details
Closed on
Nov 4, 2009
Sold by
Luckey Thomas A
Bought by
Luckey Thomas A and Luckey Cathie A
Home Financials for this Owner
Home Financials are based on the most recent Mortgage that was taken out on this home.
Original Mortgage
$800,000
Interest Rate
4.83%
Mortgage Type
New Conventional
Create a Home Valuation Report for This Property
The Home Valuation Report is an in-depth analysis detailing your home's value as well as a comparison with similar homes in the area
Home Values in the Area
Average Home Value in this Area
Purchase History
| Date | Buyer | Sale Price | Title Company |
|---|---|---|---|
| Quiet Cove 12 Llc | $254 | None Available | |
| Quiet Cove 12 Llc | $1,200,000 | Ticor Title | |
| Luckey Thomas A | -- | None Available | |
| Luckey Thomas A | -- | None Available | |
| Luckey Thomas A | -- | First Centennial Reno |
Source: Public Records
Mortgage History
| Date | Status | Borrower | Loan Amount |
|---|---|---|---|
| Previous Owner | Luckey Thomas A | $800,000 |
Source: Public Records
Tax History Compared to Growth
Tax History
| Year | Tax Paid | Tax Assessment Tax Assessment Total Assessment is a certain percentage of the fair market value that is determined by local assessors to be the total taxable value of land and additions on the property. | Land | Improvement |
|---|---|---|---|---|
| 2025 | $27,867 | $1,221,185 | $1,050,000 | $171,185 |
| 2024 | $27,867 | $1,187,784 | $1,015,000 | $172,784 |
| 2023 | $27,180 | $1,175,118 | $1,015,000 | $160,118 |
| 2022 | $26,242 | $1,068,202 | $918,750 | $149,452 |
| 2021 | $25,447 | $975,533 | $833,000 | $142,533 |
| 2020 | $24,717 | $972,829 | $833,000 | $139,829 |
| 2019 | $24,006 | $962,140 | $824,250 | $137,890 |
| 2018 | $22,908 | $833,479 | $710,500 | $122,979 |
| 2017 | $20,387 | $769,423 | $710,500 | $58,923 |
| 2016 | $19,881 | $674,552 | $612,500 | $62,052 |
| 2015 | $19,793 | $674,552 | $612,500 | $62,052 |
| 2014 | $19,710 | $671,731 | $612,500 | $59,231 |
Source: Public Records
Map
Nearby Homes
- 174 Myron Dr
- 1146 Highway 50
- 1227 Highway 50
- 261 Eagle Ln
- 213 Cedar Ridge
- 207 Cedar Ridge Dr
- 228 Bedell Ave
- 1300 Cave Rock Dr
- 1310 Cave Rock Dr Unit A
- 1337 Winding Way
- 1348 Winding Way
- 664 Lookout Rd
- 670 Riven Rock Rd
- 227 S Martin Dr
- 225 S Martin Dr
- 621 Lakeview Dr
- 1374 Winding Way
- 605 Jerry Dr
- 275 Chukkar Dr
- 625 Lake Shore Blvd
- 1034 Skyland Dr
- 1048 Skyland Dr
- 1030 Skyland Dr
- 1040 Skyland Dr
- 1032 Skyland Dr
- 1035 Skyland Dr
- 1031 Skyland Dr
- 1050 Skyland Dr
- 1039 Skyland Dr
- 1037 Skyland Dr
- 1041 Skyland Dr
- 105 Tahoe Dr
- 1028 Skyland Dr
- 1028 Skyland Dr
- 1058 Skyland Dr
- 1047 Skyland Dr
- 126 Tahoe Dr
- 1049 Skyland Dr
- 1028 Skyland Dr
- 1024 Skyland Dr