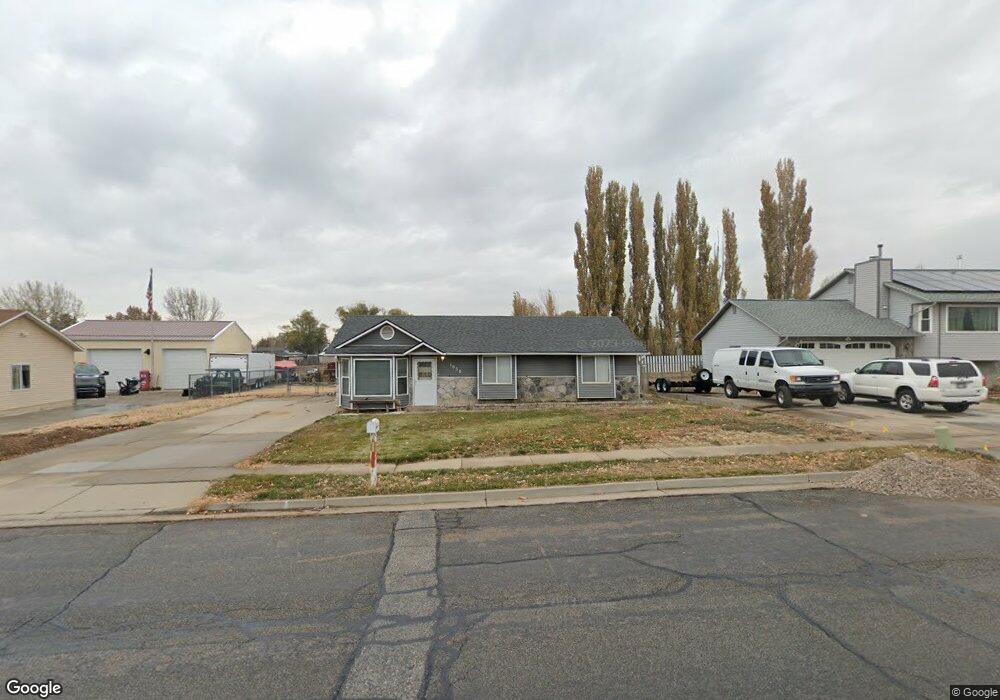
1038 W 2050 N Clearfield, UT 84015
Estimated Value: $386,073 - $399,000
3
Beds
1
Bath
1,032
Sq Ft
$382/Sq Ft
Est. Value
About This Home
This home is located at 1038 W 2050 N, Clearfield, UT 84015 and is currently estimated at $394,518, approximately $382 per square foot. 1038 W 2050 N is a home located in Davis County with nearby schools including Parkside Elementary School, Sunset Junior High School, and Clearfield High School.
Ownership History
Date
Name
Owned For
Owner Type
Purchase Details
Closed on
Mar 11, 2009
Sold by
Dejong David J
Bought by
Dejong David J and Dejong Stephanie M
Current Estimated Value
Home Financials for this Owner
Home Financials are based on the most recent Mortgage that was taken out on this home.
Original Mortgage
$130,240
Outstanding Balance
$82,019
Interest Rate
5.03%
Mortgage Type
FHA
Estimated Equity
$312,499
Purchase Details
Closed on
Aug 31, 2004
Sold by
Hinrichs William C and Hinrichs Patricia A
Bought by
Dejong David J
Purchase Details
Closed on
Jul 25, 2000
Sold by
Ovard Chris T and Ovard Katrina A
Bought by
Hinrichs William C and Hinrichs Patricia A
Home Financials for this Owner
Home Financials are based on the most recent Mortgage that was taken out on this home.
Original Mortgage
$102,339
Interest Rate
8.07%
Create a Home Valuation Report for This Property
The Home Valuation Report is an in-depth analysis detailing your home's value as well as a comparison with similar homes in the area
Home Values in the Area
Average Home Value in this Area
Purchase History
| Date | Buyer | Sale Price | Title Company |
|---|---|---|---|
| Dejong David J | -- | Founders Title Co Layton | |
| Dejong David J | -- | Surety Title Agency | |
| Hinrichs William C | -- | Mountain View Title & Escrow |
Source: Public Records
Mortgage History
| Date | Status | Borrower | Loan Amount |
|---|---|---|---|
| Open | Dejong David J | $130,240 | |
| Previous Owner | Hinrichs William C | $102,339 |
Source: Public Records
Tax History Compared to Growth
Tax History
| Year | Tax Paid | Tax Assessment Tax Assessment Total Assessment is a certain percentage of the fair market value that is determined by local assessors to be the total taxable value of land and additions on the property. | Land | Improvement |
|---|---|---|---|---|
| 2025 | $1,825 | $175,450 | $97,563 | $77,887 |
| 2024 | $1,770 | $171,050 | $106,474 | $64,576 |
| 2023 | $1,621 | $290,000 | $122,489 | $167,511 |
| 2022 | $1,712 | $169,401 | $73,288 | $96,113 |
| 2021 | $1,567 | $230,000 | $93,850 | $136,150 |
| 2020 | $1,349 | $196,000 | $81,120 | $114,880 |
| 2019 | $1,332 | $189,000 | $92,260 | $96,740 |
| 2018 | $1,176 | $164,000 | $76,835 | $87,165 |
| 2016 | $1,012 | $72,820 | $30,225 | $42,595 |
| 2015 | $966 | $66,110 | $30,225 | $35,885 |
| 2014 | $896 | $62,329 | $30,225 | $32,104 |
| 2013 | -- | $75,062 | $25,230 | $49,832 |
Source: Public Records
Map
Nearby Homes