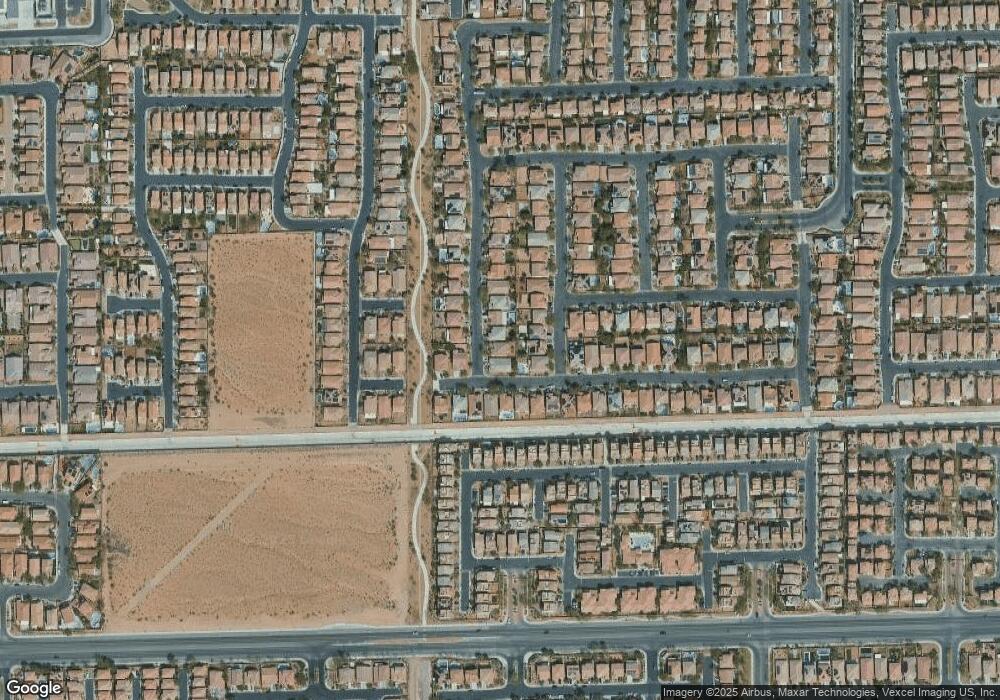
10380 Kadumba St Las Vegas, NV 89178
Mountains Edge NeighborhoodEstimated Value: $588,422 - $625,000
5
Beds
4
Baths
3,238
Sq Ft
$188/Sq Ft
Est. Value
About This Home
This home is located at 10380 Kadumba St, Las Vegas, NV 89178 and is currently estimated at $607,356, approximately $187 per square foot. 10380 Kadumba St is a home located in Clark County with nearby schools including Carolyn S. Reedom Elementary School, Desert Oasis High School, and Doral Academy West Pebble.
Ownership History
Date
Name
Owned For
Owner Type
Purchase Details
Closed on
Dec 9, 2024
Sold by
Yu Yuan and Yu Polly
Bought by
Yu Family Trust and Yu
Current Estimated Value
Purchase Details
Closed on
Sep 3, 2008
Sold by
Beazer Homes Holdings Corp
Bought by
Yu Yuan and Yu Polly
Home Financials for this Owner
Home Financials are based on the most recent Mortgage that was taken out on this home.
Original Mortgage
$233,641
Interest Rate
6.49%
Mortgage Type
Unknown
Create a Home Valuation Report for This Property
The Home Valuation Report is an in-depth analysis detailing your home's value as well as a comparison with similar homes in the area
Home Values in the Area
Average Home Value in this Area
Purchase History
| Date | Buyer | Sale Price | Title Company |
|---|---|---|---|
| Yu Family Trust | -- | None Listed On Document | |
| Yu Yuan | $311,521 | First American Title Centra |
Source: Public Records
Mortgage History
| Date | Status | Borrower | Loan Amount |
|---|---|---|---|
| Previous Owner | Yu Yuan | $233,641 |
Source: Public Records
Tax History Compared to Growth
Tax History
| Year | Tax Paid | Tax Assessment Tax Assessment Total Assessment is a certain percentage of the fair market value that is determined by local assessors to be the total taxable value of land and additions on the property. | Land | Improvement |
|---|---|---|---|---|
| 2025 | $2,777 | $178,773 | $42,000 | $136,773 |
| 2024 | $2,697 | $178,773 | $42,000 | $136,773 |
| 2023 | $2,697 | $169,456 | $40,250 | $129,206 |
| 2022 | $2,618 | $148,668 | $31,500 | $117,168 |
| 2021 | $2,542 | $141,023 | $29,750 | $111,273 |
| 2020 | $2,465 | $139,287 | $29,400 | $109,887 |
| 2019 | $2,393 | $135,022 | $26,950 | $108,072 |
| 2018 | $2,323 | $115,502 | $22,750 | $92,752 |
| 2017 | $3,297 | $112,414 | $21,700 | $90,714 |
| 2016 | $2,200 | $102,546 | $17,500 | $85,046 |
| 2015 | $2,196 | $95,610 | $14,000 | $81,610 |
| 2014 | $2,132 | $70,503 | $8,750 | $61,753 |
Source: Public Records
Map
Nearby Homes
- 7265 Sterling Rock Ave
- 7247 Sterling Rock Ave
- 7312 Acopa Ave
- 7209 Sterling Rock Ave
- 10479 Asana St
- 10297 Burwood St
- 10449 Forked Run St
- 10423 Wildflower Gully St
- 7409 Painted Mural Ave
- 10328 Planter Box St
- 10195 Tait St
- 10568 Peach Creek St
- 10165 Tait St
- 10421 Badger Ravine St
- 10598 Cliff Lake St
- 10281 Numaga Rd
- 7558 Schuders Ave
- 7513 Brisa Del Mar Ave
- 7578 Schuders Ave
- 7510 Perla Del Mar Ave
- 10370 Kadumba St
- 10390 Kadumba St
- 10360 Kadumba St
- 10379 Kalang St
- 10389 Kalang St
- 10369 Kalang St
- 10350 Kadumba St
- 10359 Kalang St
- 10371 Kadumba St
- 7291 Childers Ave
- 7299 Childers Ave
- 10361 Kadumba St
- 7324 Childers Ave
- 10349 Kalang St
- 7307 Childers Ave
- 10340 Kadumba St
- 7275 Childers Ave
- 10351 Kadumba St
- 7315 Childers Ave Unit 2
- 10339 Kalang St
