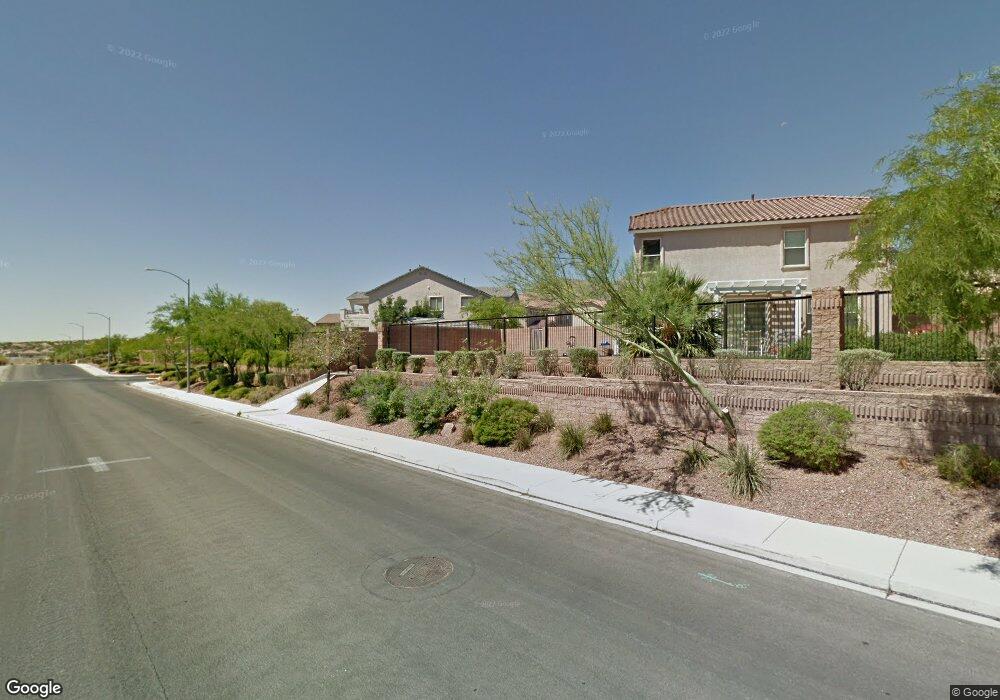
10385 Great Glen Ct Las Vegas, NV 89129
Lone Mountain NeighborhoodEstimated Value: $618,538 - $665,000
3
Beds
3
Baths
2,492
Sq Ft
$260/Sq Ft
Est. Value
About This Home
This home is located at 10385 Great Glen Ct, Las Vegas, NV 89129 and is currently estimated at $646,885, approximately $259 per square foot. 10385 Great Glen Ct is a home located in Clark County with nearby schools including Eileen Conners Elementary School, Justice Myron E Leavitt Middle School, and Centennial High School.
Ownership History
Date
Name
Owned For
Owner Type
Purchase Details
Closed on
Mar 17, 2004
Sold by
Mishlove Jeffrey and Barlow Janelle M
Bought by
Cosenza Jonathan C
Current Estimated Value
Home Financials for this Owner
Home Financials are based on the most recent Mortgage that was taken out on this home.
Original Mortgage
$169,000
Outstanding Balance
$78,430
Interest Rate
5.57%
Mortgage Type
Stand Alone First
Estimated Equity
$568,455
Purchase Details
Closed on
Jan 22, 2004
Sold by
Kb Home Nevada Inc
Bought by
Mishlove Jeffrey and Barlow Janelle M
Home Financials for this Owner
Home Financials are based on the most recent Mortgage that was taken out on this home.
Original Mortgage
$169,000
Outstanding Balance
$78,430
Interest Rate
5.57%
Mortgage Type
Stand Alone First
Estimated Equity
$568,455
Create a Home Valuation Report for This Property
The Home Valuation Report is an in-depth analysis detailing your home's value as well as a comparison with similar homes in the area
Home Values in the Area
Average Home Value in this Area
Purchase History
| Date | Buyer | Sale Price | Title Company |
|---|---|---|---|
| Cosenza Jonathan C | $387,000 | Equity Title Of Nevada | |
| Mishlove Jeffrey | $268,813 | First American Title Co Of |
Source: Public Records
Mortgage History
| Date | Status | Borrower | Loan Amount |
|---|---|---|---|
| Open | Cosenza Jonathan C | $169,000 | |
| Previous Owner | Mishlove Jeffrey | $235,700 |
Source: Public Records
Tax History Compared to Growth
Tax History
| Year | Tax Paid | Tax Assessment Tax Assessment Total Assessment is a certain percentage of the fair market value that is determined by local assessors to be the total taxable value of land and additions on the property. | Land | Improvement |
|---|---|---|---|---|
| 2025 | $4,256 | $167,667 | $57,050 | $110,617 |
| 2024 | $5,015 | $167,667 | $57,050 | $110,617 |
| 2023 | $5,015 | $150,639 | $46,900 | $103,739 |
| 2022 | $3,317 | $136,713 | $41,650 | $95,063 |
| 2021 | $3,071 | $126,831 | $36,750 | $90,081 |
| 2020 | $2,849 | $123,571 | $34,300 | $89,271 |
| 2019 | $2,670 | $119,737 | $31,850 | $87,887 |
| 2018 | $2,548 | $109,655 | $25,550 | $84,105 |
| 2017 | $3,378 | $102,895 | $23,800 | $79,095 |
| 2016 | $2,658 | $88,017 | $19,250 | $68,767 |
| 2015 | $2,380 | $70,287 | $14,000 | $56,287 |
| 2014 | $2,310 | $68,985 | $10,500 | $58,485 |
Source: Public Records
Map
Nearby Homes
- 10428 Snowdon Flat Ct
- 10365 Cherokee Corner Ave
- 10476 Wellington Manor Ave Unit 5
- 10290 Gilmore Canyon Ct Unit 103
- 10425 Denali Ridge Ct
- 10485 Canyon Cliff Ct Unit 5
- 3935 Legend Hills St Unit 104
- 3930 Legend Hills St Unit 102
- 4033 Baxter Peak St
- 3920 Legend Hills St Unit 202
- 3929 Philomena St
- 10190 Deerfield Beach Ave Unit 202
- 3915 Palm Beach St Unit 201
- 10191 Deerfield Beach Ave Unit 202
- 10181 Deerfield Beach Ave Unit 102
- 10231 Delray Beach Ave Unit 201
- 3908 Badgerbrook St
- 10221 Delray Beach Ave Unit 201
- 10180 Delray Beach Ave Unit 202
- 3945 Bayamon St
- 10381 Great Glen Ct
- 10389 Great Glen Ct
- 10380 Great Glen Ct
- 4054 Laurel Flat Ct Unit none
- 4054 Laurel Flat Ct
- 10388 Great Glen Ct
- 10384 Great Glen Ct
- 10384 Great Glen Ct Unit X
- 4050 Laurel Flat Ct Unit 1
- 10400 Snowdon Flat Ct Unit 2
- 10381 Smokemont Ct
- 10405 Snowdon Flat Ct
- 10385 Smokemont Ct
- 10377 Smokemont Ct
- 4046 Laurel Flat Ct
- 10404 Snowdon Flat Ct
- 10401 Wellington Manor Ave Unit 1
- 10408 Wellington Manor Ave
- 10389 Smokemont Ct
- 10409 Snowdon Flat Ct