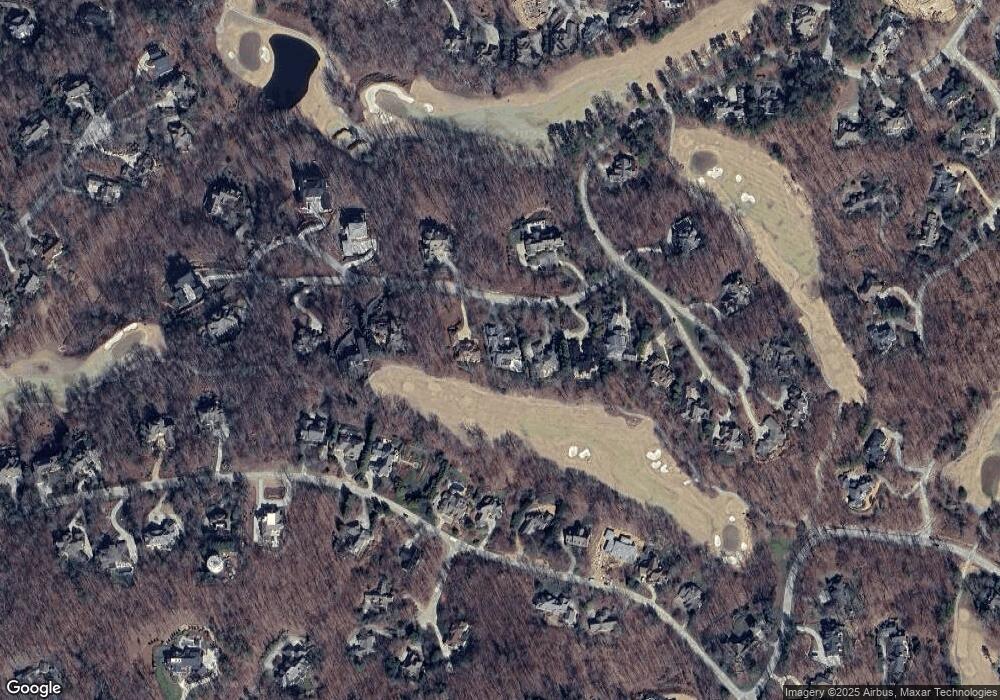
10385 Holt Unit 1209 Chapel Hill, NC 27517
Governors Club NeighborhoodEstimated Value: $2,584,000 - $3,481,000
5
Beds
6
Baths
6,453
Sq Ft
$472/Sq Ft
Est. Value
About This Home
This home is located at 10385 Holt Unit 1209, Chapel Hill, NC 27517 and is currently estimated at $3,042,709, approximately $471 per square foot. 10385 Holt Unit 1209 is a home located in Chatham County with nearby schools including North Chatham Elementary School and Margaret B. Pollard Middle School.
Ownership History
Date
Name
Owned For
Owner Type
Purchase Details
Closed on
Nov 18, 2021
Sold by
Taggart Regina and Taggart James V
Bought by
Evans Suzanne M and Orr Melonie
Current Estimated Value
Home Financials for this Owner
Home Financials are based on the most recent Mortgage that was taken out on this home.
Original Mortgage
$1,920,000
Outstanding Balance
$1,755,648
Interest Rate
2.99%
Mortgage Type
New Conventional
Estimated Equity
$1,287,061
Purchase Details
Closed on
May 12, 2021
Sold by
Rudolph Frank William and Rudolph Jeanne Therese
Bought by
Taggart James V and Taggart Regina
Purchase Details
Closed on
Feb 11, 2021
Sold by
Futrell John T and Futrell Julie D
Bought by
Rudolph Frank William and Rudolph Jeanne Therese
Purchase Details
Closed on
Oct 16, 2012
Sold by
Krauss Ray and Krauss Diane E
Bought by
Futrell John T and Futrell Julie D
Create a Home Valuation Report for This Property
The Home Valuation Report is an in-depth analysis detailing your home's value as well as a comparison with similar homes in the area
Home Values in the Area
Average Home Value in this Area
Purchase History
| Date | Buyer | Sale Price | Title Company |
|---|---|---|---|
| Evans Suzanne M | $2,550,000 | None Available | |
| Taggart James V | $2,400,000 | None Available | |
| Rudolph Frank William | $2,300,000 | None Available | |
| Futrell John T | $355,000 | None Available |
Source: Public Records
Mortgage History
| Date | Status | Borrower | Loan Amount |
|---|---|---|---|
| Open | Evans Suzanne M | $1,920,000 |
Source: Public Records
Tax History Compared to Growth
Tax History
| Year | Tax Paid | Tax Assessment Tax Assessment Total Assessment is a certain percentage of the fair market value that is determined by local assessors to be the total taxable value of land and additions on the property. | Land | Improvement |
|---|---|---|---|---|
| 2025 | $16,209 | $2,286,594 | $341,250 | $1,945,344 |
| 2024 | $16,209 | $1,572,128 | $285,000 | $1,287,128 |
| 2023 | $13,547 | $1,572,128 | $285,000 | $1,287,128 |
| 2022 | $12,435 | $1,572,128 | $285,000 | $1,287,128 |
| 2021 | $11,653 | $1,491,326 | $285,000 | $1,206,326 |
| 2020 | $10,469 | $1,329,613 | $383,625 | $945,988 |
| 2019 | $10,469 | $1,329,613 | $383,625 | $945,988 |
| 2018 | $9,812 | $1,329,613 | $383,625 | $945,988 |
| 2017 | $9,812 | $1,329,613 | $383,625 | $945,988 |
| 2016 | $10,514 | $1,414,656 | $412,500 | $1,002,156 |
| 2015 | $10,346 | $1,414,656 | $412,500 | $1,002,156 |
| 2014 | -- | $521,250 | $371,250 | $150,000 |
| 2013 | -- | $371,250 | $371,250 | $0 |
Source: Public Records
Map
Nearby Homes