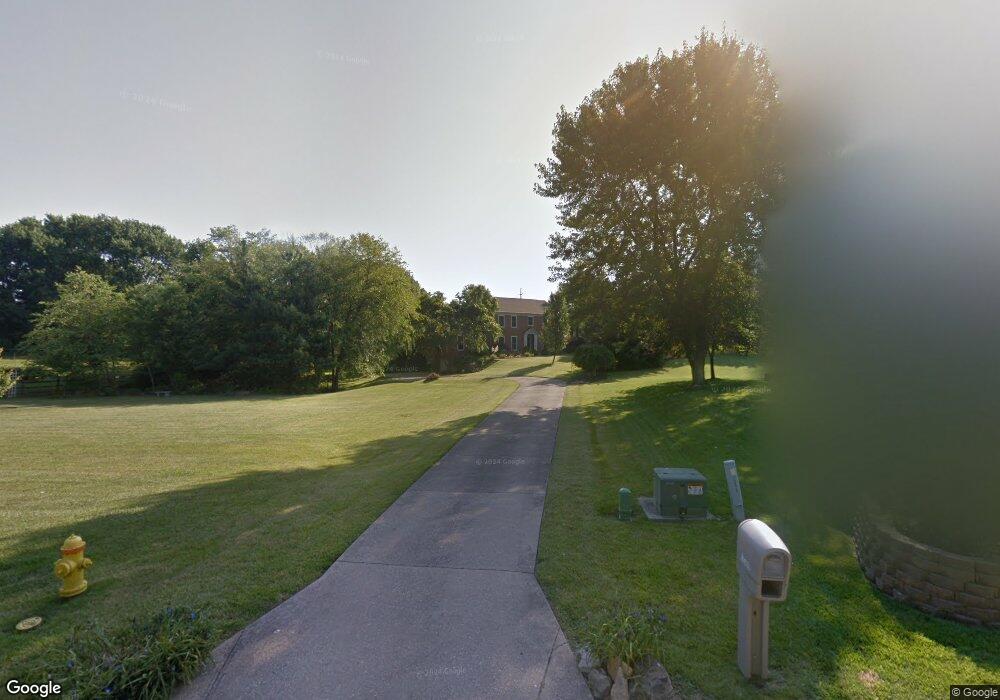
10386 Lanes End Cir Florence, KY 41042
Estimated Value: $471,000 - $529,000
4
Beds
3
Baths
2,676
Sq Ft
$187/Sq Ft
Est. Value
About This Home
This home is located at 10386 Lanes End Cir, Florence, KY 41042 and is currently estimated at $499,231, approximately $186 per square foot. 10386 Lanes End Cir is a home located in Boone County with nearby schools including Ockerman Elementary School, Gray Middle School, and Larry A. Ryle High School.
Ownership History
Date
Name
Owned For
Owner Type
Purchase Details
Closed on
Nov 6, 2024
Sold by
Chmiel Jason and Chmiel Julie
Bought by
Jason Chmiel And Julie Chmiel Trust
Current Estimated Value
Purchase Details
Closed on
Apr 23, 2010
Sold by
Chmiel Jason and Chmiel Julie
Bought by
Chmiel Jason and Chmiel Julie
Home Financials for this Owner
Home Financials are based on the most recent Mortgage that was taken out on this home.
Original Mortgage
$245,000
Interest Rate
4.99%
Mortgage Type
New Conventional
Purchase Details
Closed on
Jun 12, 2000
Sold by
Dickman William
Bought by
Mccreary Ronald D and Mccreary Connie
Home Financials for this Owner
Home Financials are based on the most recent Mortgage that was taken out on this home.
Original Mortgage
$176,000
Interest Rate
7.25%
Mortgage Type
New Conventional
Purchase Details
Closed on
Oct 2, 1997
Sold by
Kelly Anthony
Bought by
William Dickman
Create a Home Valuation Report for This Property
The Home Valuation Report is an in-depth analysis detailing your home's value as well as a comparison with similar homes in the area
Home Values in the Area
Average Home Value in this Area
Purchase History
| Date | Buyer | Sale Price | Title Company |
|---|---|---|---|
| Jason Chmiel And Julie Chmiel Trust | -- | None Listed On Document | |
| Jason Chmiel And Julie Chmiel Trust | -- | None Listed On Document | |
| Chmiel Jason | -- | Service Link | |
| Mccreary Ronald D | $220,000 | -- | |
| William Dickman | $230,000 | -- |
Source: Public Records
Mortgage History
| Date | Status | Borrower | Loan Amount |
|---|---|---|---|
| Previous Owner | Chmiel Jason | $245,000 | |
| Previous Owner | Mccreary Ronald D | $176,000 | |
| Closed | William Dickman | -- |
Source: Public Records
Tax History Compared to Growth
Tax History
| Year | Tax Paid | Tax Assessment Tax Assessment Total Assessment is a certain percentage of the fair market value that is determined by local assessors to be the total taxable value of land and additions on the property. | Land | Improvement |
|---|---|---|---|---|
| 2024 | $4,209 | $392,400 | $55,000 | $337,400 |
| 2023 | $3,405 | $304,650 | $40,000 | $264,650 |
| 2022 | $3,344 | $304,650 | $40,000 | $264,650 |
| 2021 | $3,426 | $304,650 | $40,000 | $264,650 |
| 2020 | $3,411 | $304,650 | $40,000 | $264,650 |
| 2019 | $3,437 | $304,650 | $40,000 | $264,650 |
| 2018 | $3,399 | $304,650 | $40,000 | $264,650 |
| 2017 | $3,345 | $304,650 | $40,000 | $264,650 |
| 2015 | $3,229 | $304,650 | $40,000 | $264,650 |
| 2013 | -- | $310,000 | $28,000 | $282,000 |
Source: Public Records
Map
Nearby Homes
- 10445 Jasons Bluff
- 10143 Cedarwood Dr
- 3 Lots Tiburon Dr
- 760 Oakridge Dr
- 10474 Remy Ln
- 207 Melinda Ln
- 943 Lakepointe Ct
- 10070 Cedarwood Dr
- 10202 Cardigan Dr
- 2011 Holderness Dr
- 460 Marian Ln Unit 3
- 10067 Hempsteade Dr
- 380 Deer Trace Dr
- 10160 Carnation Ct Unit 5
- 612 Friars Ln Unit 6
- 1110 Mount Zion Rd
- 10124 Carnation Ct Unit 4
- 10354 Frank Duke Blvd
- 10605 Pimlico Park
- 10723 Saint Leger Cir
- 10380 Lanes End Cir
- 767 Brittany Trail
- 761 Brittany Trail
- 10392 Lanes End Cir
- 10383 Tiburon Dr
- 773 Brittany Trail
- 122 Brittany Trail
- 785 Brittany Trail
- 10375 Tiburon Dr
- 10393 Lanes End Cir
- 10374 Lanes End Cir
- 10381 Lanes End Cir
- 764 Brittany Trail
- 770 Brittany Trail
- 10375 Lanes End Cir
- 797 Brittany Trail
- 10363 Tiburon Dr
- 776 Brittany Trail
- 10369 Lanes End Cir
- 10368 Lanes End Cir