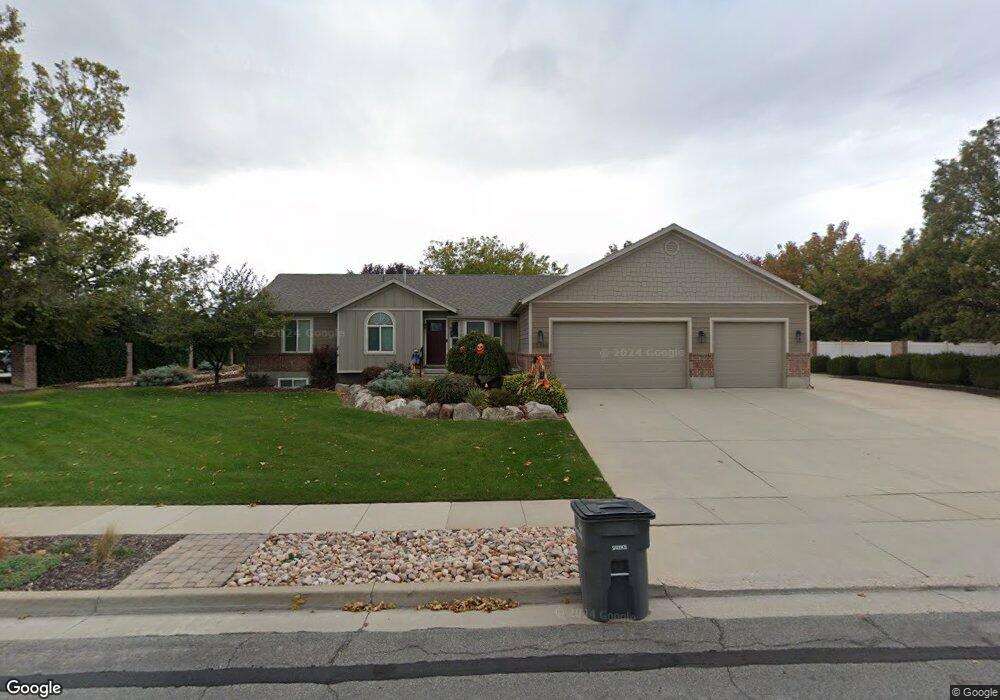
10386 S 2840 W Unit 1 South Jordan, UT 84095
Estimated Value: $742,000 - $840,243
5
Beds
3
Baths
1,713
Sq Ft
$449/Sq Ft
Est. Value
About This Home
This home is located at 10386 S 2840 W Unit 1, South Jordan, UT 84095 and is currently estimated at $768,561, approximately $448 per square foot. 10386 S 2840 W Unit 1 is a home located in Salt Lake County with nearby schools including Jordan Ridge School, South Jordan Middle School, and Hawthorn Academy.
Ownership History
Date
Name
Owned For
Owner Type
Purchase Details
Closed on
Oct 25, 2016
Sold by
Bagley Kirk and Bagley Janis
Bought by
Bagley Kirk Diane and Bagley Janis Lee
Current Estimated Value
Purchase Details
Closed on
Dec 31, 2002
Sold by
Fannie Mae
Bought by
Bagley Kirk and Bagley Janis
Purchase Details
Closed on
Oct 29, 2002
Sold by
Darger David Glen and Mountain Shadows Mtg
Bought by
Federal National Mortgage Association
Purchase Details
Closed on
Mar 6, 2000
Sold by
Watson Bruce and Watson Susan
Bought by
Darger David Glen
Purchase Details
Closed on
Nov 12, 1998
Sold by
Bruce Watson Enterprises Inc
Bought by
Watson Bruce and Watson Susan
Home Financials for this Owner
Home Financials are based on the most recent Mortgage that was taken out on this home.
Original Mortgage
$157,178
Interest Rate
6.54%
Mortgage Type
Construction
Create a Home Valuation Report for This Property
The Home Valuation Report is an in-depth analysis detailing your home's value as well as a comparison with similar homes in the area
Home Values in the Area
Average Home Value in this Area
Purchase History
| Date | Buyer | Sale Price | Title Company |
|---|---|---|---|
| Bagley Kirk Diane | -- | None Available | |
| Bagley Kirk | -- | United Title Services | |
| Federal National Mortgage Association | $222,802 | Backman Stewart Title Servic | |
| Darger David Glen | -- | Founders Title Co | |
| Watson Bruce | -- | -- |
Source: Public Records
Mortgage History
| Date | Status | Borrower | Loan Amount |
|---|---|---|---|
| Previous Owner | Watson Bruce | $157,178 |
Source: Public Records
Tax History Compared to Growth
Tax History
| Year | Tax Paid | Tax Assessment Tax Assessment Total Assessment is a certain percentage of the fair market value that is determined by local assessors to be the total taxable value of land and additions on the property. | Land | Improvement |
|---|---|---|---|---|
| 2025 | $3,871 | $783,800 | $246,400 | $537,400 |
| 2024 | $3,871 | $734,900 | $234,700 | $500,200 |
| 2023 | $3,862 | $691,900 | $227,800 | $464,100 |
| 2022 | $3,982 | $699,100 | $223,400 | $475,700 |
| 2021 | $3,207 | $516,600 | $184,700 | $331,900 |
| 2020 | $3,081 | $465,300 | $184,700 | $280,600 |
| 2019 | $2,807 | $416,700 | $174,700 | $242,000 |
| 2018 | $2,646 | $390,800 | $173,700 | $217,100 |
| 2017 | $2,591 | $375,100 | $170,800 | $204,300 |
| 2016 | $2,637 | $361,700 | $157,900 | $203,800 |
| 2015 | $2,459 | $327,900 | $159,300 | $168,600 |
| 2014 | $2,462 | $322,700 | $151,900 | $170,800 |
Source: Public Records
Map
Nearby Homes
- 10320 S 2700 W
- 2908 W Bison Ridge Rd
- 2777 W Urban Ridge Rd
- 10177 Statesman Place
- 10688 S Bison Creek Cove Unit 20
- 3211 W Harvest Glory Dr
- 1553 W Banner Dr Unit 844
- 1578 W Banner Dr Unit 745
- 1558 W Banner Dr Unit 805
- 1574 W Banner Dr Unit 743
- 1576 W Banner Dr Unit 744
- 1556 W Banner Dr Unit 806
- 1548 W Banner Dr Unit 809
- 1552 W Banner Dr Unit 807
- 2866 W 10755 S
- 3274 W Harvest Chase Dr
- 2929 W 10755 S
- 3312 W Harvest Grove Way
- 10182 S Chattel Cir
- 2343 Temple View Cir
- 10386 S 2840 W
- 2842 W South Jordan Pkwy
- 10372 S 2840 W
- 2842 W South Jordan Pkwy
- 10381 S 2840 W
- 2888 W South Jordan Pkwy
- 2888 W South Jordan Pkwy
- 2811 W South Jordan Pkwy
- 2831 W South Jordan Pkwy
- 10369 S 2840 W
- 2831 10400 S
- 2805 W South Jordan Pkwy
- 2798 W South Jordan Pkwy
- 10358 S 2840 W
- 2930 W South Jordan Pkwy
- 2930 W South Jordan Pkwy
- 2861 W South Jordan Pkwy
- 10347 S 2840 W
- 10389 S 2950 W
- 2820 W 10460 S